Download
1 / 22
220 likes | 368 Views
Royal Military College of Canada. MEASURING AND MODELLING THE DISPERSION OF AEROSOLS FROM POINT SOURCES. William S. Andrews 1 , Xiaoying Cao 2 Gilles Roy 3 and Luc Forand 3 1. Chemistry and Chemical Engineering, RMC 2. Chemical Engineering, Queen’s University

E N D
Royal Military College of Canada MEASURING AND MODELLING THE DISPERSION OF AEROSOLS FROM POINT SOURCES William S. Andrews1, Xiaoying Cao2 Gilles Roy3 and Luc Forand3 1. Chemistry and Chemical Engineering, RMC 2. Chemical Engineering, Queen’s University 3. DRDC-RDDC Valcartier Department of Chemistry and Chemical Engineering
OUTLINE • Introduction • Experiment setup and lidar inversion • Cloud selection and Data processing • Measuremental data analysis • ANN Modelling • Model results Department of Chemistry and Chemical Engineering, RMC
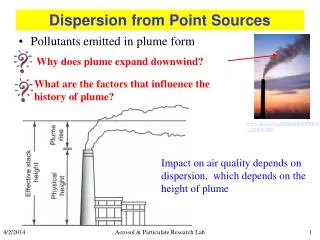
INTRODUCTION • Plumes better characterized than puffs • Basic puff model is Gaussian (usually use Slade’s dispersion coefficients - 1968) • Weak empirical basis • Poor predictions, especially close to source • Experimental program conducted 2002-2003 in Valcartier Quebec • This paper will report on initial attempts to analyze (model) data collected Department of Chemistry and Chemical Engineering, RMC
PUFF MEASUREMENT • release 10 or 20 g of aerosol from generator (150 - 200 m from lidar) • scan cloud (raster pattern) during evolution using scanning lidar @ 532 nm • sampling frequency 125 MHz (every 1.2 m) • beam “width” (elliptical) 2 mrad • 1 shot per 0.8 º azimuth (up to 82 º FOV) • 0.5 º or 1º steps in elevation Department of Chemistry and Chemical Engineering, RMC
FIELD DATA COLLECTION • 4 periods • 5-8 Nov 02, • 11-14 Mar 03, • 27-30 May 03, • 12-15 Aug 03 • 2 x 24 h cycles per period • 10 releases per material every 3 h (30) • Three separate aerosols • hollow microspheres (~ 27 μm, 0.21 g/cc) • solid glass spheres (~ 6.5 μm, 2.7g/cc) • talc (~ 22 μm) Department of Chemistry and Chemical Engineering, RMC
MICROSPHERES Department of Chemistry and Chemical Engineering, RMC
GLASS SPHERES Department of Chemistry and Chemical Engineering, RMC
TALC Department of Chemistry and Chemical Engineering, RMC
LIDAR INVERSION (Bissonnette and Roy, 2003). Department of Chemistry and Chemical Engineering, RMC
2 1 3 6 5 4 7 8 9 Department of Chemistry and Chemical Engineering, RMC
Statistics of useful clouds Department of Chemistry and Chemical Engineering, RMC
Range of meteorological conditions Department of Chemistry and Chemical Engineering, RMC
Data Processing • Lidar Inversion • Mass Center of cloud • Transport wind speed and direction • Coordinate system rotation • Center of Mass modification Department of Chemistry and Chemical Engineering, RMC
(a) (b) (c) (d) Sample ms cloud 0730 13 August 2003 Department of Chemistry and Chemical Engineering, RMC
Sample talc cloud 2230 14 August 2003 Department of Chemistry and Chemical Engineering, RMC
Sample sg cloud– 0500 15 August 2003 (a) (b) Department of Chemistry and Chemical Engineering, RMC
Concentration Distributions Department of Chemistry and Chemical Engineering, RMC
Comparison of models Department of Chemistry and Chemical Engineering, RMC
ANN Model Prediction Department of Chemistry and Chemical Engineering, RMC
Conclusions • Concentration is insensitive to particle shape, size, air pressure • Insolation, T, time after release are very important • Important turbulence parameters: CN2, CTQ, CVPT2, U_var, W_var, UV_cov, VTs_cov, WTs_cov • ANNs predict concentration distribution to be Gaussian in shape • ANN prediction closer to observations than standard Gaussian puff (Slade parameters) Department of Chemistry and Chemical Engineering, RMC
Acknowledgements • Dr. Andrews and Dr. Roy (supervisors) • Luc Forand, Guy Potvin and Luc Bissonnette • Personnel at DRDC Valcartier • NSERC, DGNS, ARP Department of Chemistry and Chemical Engineering, RMC