Download
1 / 31
310 likes | 467 Views
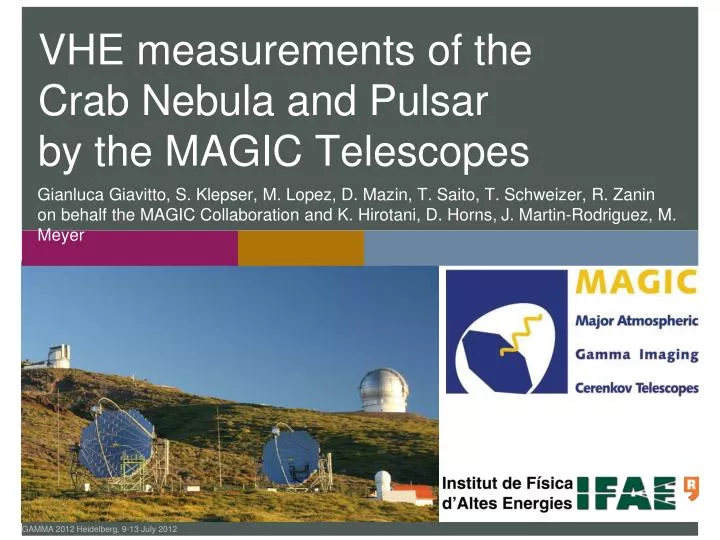
VHE measurements of the Crab Nebula and Pulsar by the MAGIC Telescopes . Gianluca Giavitto , S. Klepser, M. Lopez, D. Mazin, T. Saito, T. Schweizer, R. Zanin on behalf the MAGIC Collaboration and K. Hirotani, D. Horns, J. Martin-Rodriguez, M . Meyer. GAMMA 2012 Heidelberg, 9-13 July 2012.

E N D
VHE measurements of the Crab Nebula and Pulsar by the MAGIC Telescopes Gianluca Giavitto, S. Klepser, M. Lopez, D. Mazin, T. Saito, T. Schweizer, R. Zaninon behalf the MAGIC Collaboration and K. Hirotani, D. Horns, J. Martin-Rodriguez, M. Meyer GAMMA 2012 Heidelberg, 9-13 July 2012
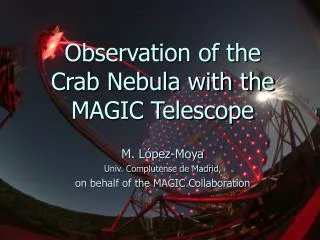
Introduction: the Crab and MAGIC • Crab Pulsar and Pulsar WindNebula well studied from radio to TeV's • Standard candle of γ-ray astronomy • Recent (2011) surprises: • Nebula: Discovery of Flares at HE (>100 MeV)AGILE (Tavani et. al 2011, Science 331:736)Fermi-LAT (Abdo et. al 2011, Science 331:739) • Pulsar:Detection at VHE(>100 GeV)VERITAS (Aliu et. al 2011, Science 334:69)MAGIC (Aleksić et. al 2011, ApJ 742:43)MAGIC (Aleksić et. al 2012,A&A 540:A69) Fermi-LAT flare of April 2011(Credit: NASA/DOE/Fermi LAT/R. Buehler)
Introduction: the Crab and MAGIC • Crab Pulsar and Pulsar WindNebula well studied from radio to TeV's • Standard candle of γ-ray astronomy • Recent (2011) surprises: • Nebula: Discovery of Flares at HE (>100 MeV)AGILE (Tavani et. al 2011, Science 331:736)Fermi-LAT (Abdo et. al 2011, Science 331:739) • Pulsar:Detection at VHE(>100 GeV)VERITAS (Aliu et. al 2011, Science 334:69)MAGIC (Aleksić et. al 2011, ApJ 742:43)MAGIC (Aleksić et. al 2012,A&A 540:A69) Crab Pulsar as seen by MAGIC(skymap of P2)
Introduction: the Crab and MAGIC • Crab Pulsar and Pulsar WindNebula well studied from radio to TeV's • Standard candle of γ-ray astronomy • Recent (2011) surprises: • Nebula: Discovery of Flares at HE (>100 MeV)AGILE (Tavani et. al 2011, Science 331:736)Fermi-LAT (Abdo et. al 2011, Science 331:739) • Pulsar:Detection at VHE(>100 GeV)VERITAS (Aliu et. al 2011, Science 334:69)MAGIC (Aleksić et. al 2011, ApJ 742:43)MAGIC (Aleksić et. al 2012,A&A 540:A69) Crab Pulsar as seen by MAGIC(skymap of P2)
The Crab Nebula GAMMA 2012 Heidelberg, 9-13 July 2012
Log Parabola Fit (only MAGIC data) 3 Decades in E 45 TeV 50 GeV Crab Nebula: spectrum Crab Nebula Spectral Energy Distribution PRELIMINARY Systematic errors: Flux = ~15% Energy = ~15% Index = ± 0.15 Γ = 2.27±0.02stat Fermi-LAT Γ = 2.53±0.02stat Stereo mode2009 – 2011Teff = 48.7 h Zenith 5°-50° Stat. errors< 5% below 100GeV
MOST PRECISE IC PEAKMEASUREMENT SO FAR: ICpeak = 59 ± 6 GeV (with Fermi-LAT data,stat. err only) Crab Nebula: spectrum Crab Nebula Spectral Energy Distribution PRELIMINARY Systematic errors: Flux = ~15% Energy = ~15% Index = ± 0.15 Fermi-LAT Stereo mode2009 – 2011Teff = 48.7 h Zenith 5°-50° Where is the cutoff? Stat. errors< 5% below 100GeV
Crab Nebula: modeling Crab Nebula modelling • Three Models: • Constant B-field(from Meyer et al. 2010, A&A 523:A2 as in Hillas et al. 1998, ApJ 503:744) • MHD flow model(from Meyer et al. 2010, A&A 523:A2 as in K&C 1984, ApJ 283:694,A&A 1996, MNRAS 278:525) • Time-dependent (as in Martin-Rodriguez et al., in prep.) –Constant B model – MHD flow model · MAGIC stereo · Fermi-LAT (Abdo et al., 2010) PRELIMINARY Stat errors only! D. Horns & M. Mayer
Crab Nebula: modeling • Three Models: • Constant B-field(from Meyer et al. 2010, A&A 523:A2 as in Hillas et al. 1998, ApJ 503:744) • MHD flow model(from Meyer et al. 2010, A&A 523:A2 as in K&C 1984, ApJ 283:694,A&A 1996, MNRAS 278:525) • Time-dependent (as in Martin-Rodriguez et al., in prep.) VERY PRELIMINARY Stat errors only! J. Martin-Rodriguez, D. Torres, N. Rea
Flux (E > 300 GeV) = (1.31 ± 0.03stat ± 0.17sys ) × 10-10 ph. cm-2 s-1 Crab Nebula: variability and flares • Was the Crab nebula also flaring at TeV's? • MAGIC measures constant flux above 300 GeVwithin systematic error of 13% to a confidence level of 95% AGILE/Fermi-LAT flare Sept. 2010 PRELIMINARY Mar. 2011 Oct. 2009
Crab Nebula: variability and flares Fermi-LAT lightcurve from Buehler et al.astro-ph:1112.1979 A closer look at the April 2011 flare Start ofFermi-LAT ToO MAGIC Observations No evidence of flaring activity! 0.7 < E < 10 TeV(observation under strong moonlight, reduced HV) Steady flux Zanin et al. ICRC 2011 Moon Phase
The Crab Pulsar GAMMA 2012 Heidelberg, 9-13 July 2012
MAGIC MONOE > 25 GeV VERITASE > 120 GeV MAGIC STEREOE > 50 GeV Crab Pulsar: recent VHE history • 2008: • MAGIC mono: discovery at E > 25 GeV rules out Polar Cap model, exp. cutoff at ~ 17 GeV(Aliu et. al 2008, Science 322:1221) 2011 – 2012: • VERITAS: pulsed emission + spectrum at E > 100 GeV(Aliu et. al 2011, Science 334:69 ) • MAGIC mono: phase-dep. spectrum 25 < E < 100 GeV(Aleksić et. al 2011, ApJ 742:43) • MAGIC stereo: phase-dep. spectrum 50 < E < 400 GeV(Aleksić et. al 2012, A&A 540:A69) Breakthrough VHE measurements exclude exp.cutoff and challenge all existing models!
Winter 2007/2008 Winter 2008/2009 Crab Pulsar: mono observations Crab Phase Histogram 25 < E < 100 GeV • 59 hrs of data (Oct. 2007 - Feb. 2009)(Aleksić et. al 2011, ApJ 742:43) • Sum-trigger: threshold at 25 GeV • EGRET – era peak definitions:(from Fierro et al., 1998, ApJ 494:734)21% of the whole phase • Pulsation detected at 7.5σ (P1+P2)Energy range: 25 < E < 100 GeV • Indication that peaks become narrower than at MeV energies • No significant inter-peak emission, no other significant peaks • No significant yearly variablility
Crab Pulsar: mono observations MAGIC MONO phase-averaged spectrum (P1+P2) ΓP1+P2 = 3.4 ± 0.5stat Systematic errors: Flux = ~20% Energy = ~16% Index = ± 0.3 5.8σ
Crab Pulsar: mono observations MAGIC MONO phase-averaged spectrum (P1) ΓP1 = 3.1 ± 1.0stat Systematic errors: Flux = ~20% Energy = ~16% Index = ± 0.3 2.5σ
Crab Pulsar: mono observations MAGIC MONO phase-averaged spectrum (P2) ΓP1 = 3.4 ± 0.5stat Systematic errors: Flux = ~20% Energy = ~16% Index = ± 0.3 4.7σ
46 < Eest < 416 GeV <Etrue> ~ 100 GeV 138 < Eest < 416 GeV <Etrue> ~ 180 GeV 46 < Eest < 138 GeV <Etrue> ~ 80 GeV Crab Pulsar: stereo observations Crab Pulsar Stereo Phase Histograms • 73 hrs of data (Oct. 2009 - Mar. 2011)(Aleksić et. al 2012, A&A 540:A69) • Stereo: less background, smaller systematics. • Pulsation firmly detectedH test (unbinned) : 6.4σ χ2 test : 7.7σEGRET-peaks (a-priori) : 7.7σ • Peaks get narrower w/energy • New peak definitions±2σFIT:a posteriori, 8.8% of the whole phase • LE: Possible 3.4σ hint at TW1[ 0.04 : 0.14 ](Fermi-LAT spectrum is harder here too) Full EnergyRange High EnergyRange Low EnergyRange
Crab Pulsar: stereo observations MAGIC Fermi-LAT • Stereo spectrum: Power law, joins Fermi-LAT, MAGIC mono and VERITAS • P2 is twice as strong as P1 • Spectra for MAGIC (a posteriori) and EGRET (a priori) phase definitions match • No significant yearly variability Pulsar (Fermi-LAT) Nebula (MAGIC) MAGIC MONO Nebula (Fermi-LAT) MAGIC STEREO Γ = 3.6 ± 0.3stat P1+P2 VERITAS Systematic errors: Flux = ~17% Energy = ~19% Index = ± 0.20 MAGIC STEREO Γ = 3.4 ± 0.8stat MAGIC STEREO Γ = 4.0 ± 0.8stat P1 P2
Crab Pulsar: models • New evidence → new models:older ones cannot explain emission up to 400 GeV • Extension of OG model: (as in Hirotani, K. 2006, Mod. Phys. Lett. A, 21:1319) • Magnetospheric cascade:VHE pulsed γ-rays are produced via SSC by secondary and tertiary pairs • Other possiblities: • IC upscattering of pulsed X photons in “Dark wind region” outside the LC (Aharonian et al. 2012, Nature letters) • Synchrotron emission or Curvature emission by ultra-relativistic particles @ LC(Chkheidze et al., 2011,ApJ 730:62)(Bednarek W., 2012,arXiv:1205.4855, accepted MNRAS ) • IC of secondary pairs in Annular gap(Du et al., 2012 ApJ 748:84) P1+P2 Is there a 2nd component or a cutoff? crucial points now structures at ~100 GeVemission at > 500 GeV see T.Saito's poster
Wrap-up and Conclusion • MAGIC has measured VHE gamma-ray emission from both the Crab Nebula and Pulsar with an unprecedented accuracy: • Nebula IC peak measured: ICpeak = 59 ± 6 GeVNo evidence of flaring during the two HE flares of 2010 and 2011 • First VHE Pulsar phase-resolved spectrum, from 25 to 400 GeVPower law extension of Crab pulsar spectrum confirmed! • Surprises from old friend: still a lot to learn, many open questions! • Completion of upgrade (new cameras, new readout, new stereo-sumtrigger) will allow MAGIC to answer some of them.
Backup slides GAMMA 2012 Heidelberg, 9-13 July 2012
Crab Nebula Spectral Energy Distribution Γ = -2.27±0.02stat Γ = -2.53±0.02stat MOST PRECISE IC PEAKMEASUREMENT SO FAR: ICpeak = 59 ± 6 GeV (with Fermi-LAT data,stat. err only) Log Parabola Fit (only MAGIC data) 3 Decades in E 45 TeV 50 GeV Crab Nebula: spectrum • Stereo mode2009 – 2011Teff = 48.7 h • Zenith 5°-50° PRELIMINARY Systematic errors: Flux = 15% Energy = 17% Index = ± 0.15 Fermi-LAT Where is the cutoff? Stat. errors< 5% below 100GeV
Log Parabola Fit (only MAGIC data) 3 Decades in energy 50 GeV 45 TeV Crab Nebula: spectrum Crab Nebula Differential Energy Spectrum • Stereo mode2009 – 2011Teff = 48.7 h • Zenith 5°-50° PRELIMINARY 8 decades in flux Systematic errors: Flux = 15% Energy = 17% Index = ± 0.15
Crab Nebula: modeling Crab Nebula modelling • Two Models:(from Meyer et al. 2010, A&A 523:A2) • Constant B-field(as in Hillas et al. 1998, ApJ 503:744) • MHD flow model(as in K&C 1984, ApJ 283:694,A&A 1996, MNRAS 278:525) • No model matches well the data within statistical errors(both do within system. errors) • Need for more precise measurements with less systematic errors –Constant B model – MHD flow model · MAGIC stereo · Fermi-LAT (Abdo et al., 2010) PRELIMINARY Stat errors only! D. Horns & M. Mayer
Crab Nebula: spectrum Crab Nebula Differential Energy Spectrum • Observations: • Stereo modeTeff = 48.7 h • Zenith 5°-50° • New analysis method(sum cleaning) • Spectrum: • Energy range:50 GeV < E < 45 TeV • Log-parabola fit:Γ = -2.27±0.02stat (E=100GeV)Γ = -2.53±0.02stat (E=10TeV) • Statistical errors~ 5% below 100 GeV 8 decades in flux PRELIMINARY 3 Decades in energy 50 GeV 45 TeV Systematic errors: Flux = 15% Energy scale = 15 – 17% Photon index = ±0.15
Crab Nebula: spectrum Crab Nebula Spectral Energy Distribution • IC peak position fit combines MAGIC &Fermi-LAT points(Abdo et. al 2010, ApJ 708:1254) • Impossible to confirm or reject cutoff at E >10 TeV • Dominated by systematic errors PRELIMINARY MOST PRECISE IC PEAKMEASUREMENT SO FAR: ICpeak = 59 ± 6 GeV (stat. err only) ICpeak HEGRA / HESS discrepancy @ E > 10 TeV could not be resolved! Where is the cutoff?
MAGIC MONO w/ SUM-trigger W 07-08 FERMI-LAT W 08-09 MAGIC STEREO W 09-10 W 10-11 W 11-12 Crab Pulsar: recent VHE history Cutoff at ~17 GeV • MAGIC (mono) discovery at E > 25 GeV: rules out Polar Cap model(Aliu et. al 2008, Science 322:1221) • Fermi-LAT: P1+P2 cutoff at E ~ 6 GeV, around P2 cutoff is up to E > 10 GeV(Abdo et. al 2010, Science 322:1221) • VERITAS: pulsed emission at E > 100 GeV,excludes exponential cutoff(Fermi Symposium, Rome 2011, Aliu et. al 2011, Science 334:69 ) • MAGIC mono: phase-dep. spectrum 25 < E < 100 GeV, excludes exp. cutoff(ICRC, Beijing 2011, Aleksić et. al 2011, ApJ 742:43) • MAGIC confirms detection up to 400 GeV, measures phase-dependent spectrum(Aleksić et. al 2012, A&A 540:A69) 6.4σ E>25 GeV (3.4σ P2 at E>60GeV) Phase-averaged spectrum with exponential cutoff at ~ 6 GeV however last point is systematically higher!! Breakthrough VHE measure-ments Exclude cutoff Challenge all existing theoretical models VERITASE > 120 GeV MAGICE > 50 GeV
Crab Pulsar: recent VHE history Cutoff at ~17 GeV • 2008 – 2010: • MAGIC (mono) discovery at E > 25 GeV: rules out Polar Cap model(Aliu et. al 2008, Science 322:1221) • Fermi-LAT: P1+P2 cutoff at E ~ 6 GeV, around P2 cutoff is up to E > 10 GeV(Abdo et. al 2010, Science 322:1221) 2011 – 2012: • VERITAS: pulsed emission at E > 100 GeV, excludes exponential cutoff(Aliu et. al 2011, Science 334:69 ) • MAGIC mono: phase-dep. spectrum 25 < E < 100 GeV(Aleksić et. al 2011, ApJ 742:43) • MAGIC stereo: phase-dependent spectrum up to 400 GeV(Aleksić et. al 2012, A&A 540:A69) The above results exclude exp. cutoff! 6.4σ E>25 GeV (3.4σ P2 at E>60GeV) Phase-averaged spectrum with exponential cutoff at ~ 6 GeV however last point is higher!! Breakthrough VHE measure-ments Challenge all existing theoretical models VERITASE > 120 GeV MAGICE > 50 GeV
Crab Pulsar: stereo observations • 73 hrs of data (Oct. 2009 - Mar. 2011)(Aleksić et. al 2012, A&A 540:A69) • Stereo obs: less background, less systematics.Energy range: 50 < E < 100 GeV • Pulsation firmly detectedH-Test (unbinned) : 6.4σ EGRET-peaks (a-priori) : 7.7σ • Peaks get narrower w/energy • New peak definitions±2σFIT:8.8% of the whole phase • Possible LE 3.4σ hint at TW1[ 0.04 : 0.14 ] <Etrue> ~ 100 GeV <Etrue> ~ 180 GeV <Etrue> ~ 80 GeV MAGIC Fermi-LAT Collection of pulse half-widths vs. energy P1 P2