Download
1 / 30
410 likes | 946 Views
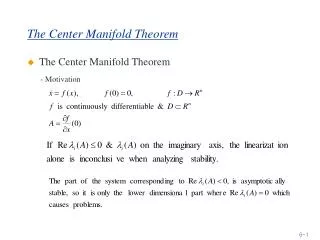
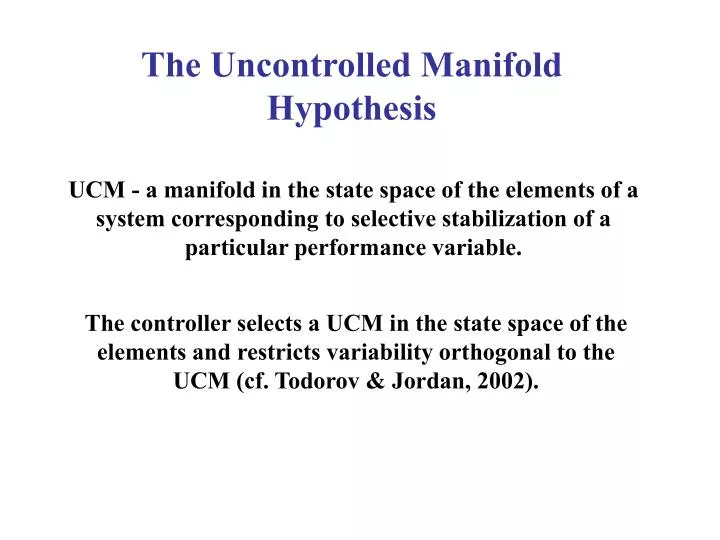
The Uncontrolled Manifold Hypothesis. UCM - a manifold in the state space of the elements of a system corresponding to selective stabilization of a particular performance variable. The controller selects a UCM in the state space of the elements and restricts variability orthogonal to the

E N D
The Uncontrolled ManifoldHypothesis UCM - a manifold in the state space of the elements of a system corresponding to selective stabilization of a particular performance variable. The controller selects a UCM in the state space of the elements and restricts variability orthogonal to the UCM (cf. Todorov & Jordan, 2002).
F + F = 6 F F 1 2 1 1 A B V V a a r r D 1 ORT ORT 5 5 > 4 4 D 4 D 2 3 3 2 2 V V a a r r UCM UCM D 3 1 1 F F 2 2 1 2 3 4 5 1 2 3 4 5 Two Solutions for a Task of Producing a Certain Value of Total Force with Two Effectors(scatters of data points in individual trials are shown)
The UCM Hypothesis: • Allows to ask a multi-element system a question: Are you a synergy with respect to a particular performance variable? • Introduces a quantitative index of synergy (for a non-synergy, this index is zero or negative); • Allows to quantify synergies in special populations, with practice, under fatigue, etc.
Steps in UCM-analysis • Identify independent elemental variables. • Compute the Jacobian relating small changes in the elemental variables to a changes in a potentially important performance variable. • Compute a UCM (null space of the Jacobian) and partition the variance in the space of elemental variables across several attempts at a task into components along the UCM and orthogonal to it. Compare them per DOF.
Enslaving makes finger forces dependent on each other.It is described with a matrix showingchanges in individual finger forceswhen only one finger is required to produce force ENSL =
For a task variable TV: From the definition of enslaving:
Oscillatory Ramp MVC 3 cm Task or or
F1 F2 Conflicting Instructions for Force-control and Torque-control in a Two-Finger Task F2 Force-control Torque-control F1
Variance per DOF Variance per DOF 3 . 0 3 . 0 F o r c e C o n t r o l : I M T a s k M o m e n t C o n t r o l : I M T a s k 2 . 5 2 . 5 2 . 0 2 . 0 1 . 5 1 . 5 1 . 0 1 . 0 0 . 5 0 . 5 0 . 0 0 . 0 0 2 0 4 0 6 0 8 0 1 0 0 0 2 0 4 0 6 0 8 0 1 0 0 P e r c e n t o f F o r c e C y c l e P e r c e n t o f F o r c e C y c l e U n c o m p e n s a t e d C o m p e n s a t e d F o r c e C o n t r o l : I M R T a s k 3 . 0 3 . 0 M o m e n t C o n t r o l : I M R T a s k 2 . 5 2 . 5 2 . 0 2 . 0 1 . 5 1 . 5 1 . 0 1 . 0 0 . 5 0 . 5 0 . 0 0 . 0 0 2 0 4 0 6 0 8 0 1 0 0 0 2 0 4 0 6 0 8 0 1 0 0 P e r c e n t o f F o r c e C y c l e P e r c e n t o f F o r c e C y c l e Two- and Three-Finger Tasks: Preferential Stabilization of Moment
What is important for patterns ofthe two components of variance? Discrete vs. oscillatory actions? Presence of a template? Fast vs. slow actions?
Results: Discrete vs. oscillatory actions? - Only minor effects. Presence of a template? - Only minor effects Fast vs. slow actions? - Major effects VUCM (COMP) shows time profiles similar to F(t); VORT (UN) shows time profiles similar to dF(t)/dt.
Uncompensated variance changes similarly to force derivative
The CNS seems to be able to co-vary the magnitudes of finger forces such that the total force is preserved. The CNS seems to have a real problem in compensating errors in the timing of individual finger force profiles.
Force plate Counter-load Wooden handle Load Experimental Setups A B Force sensors Force/moment sensors
A B 20 YoungDP 6 ElderlyDP 5 YoungPP 15 4 ElderlyPP ∑VarFi VarFTOT 10 3 2 5 1 0 0 1 2 3 4 5 1 2 3 4 5 Ramp segments Ramp segments C D 1.0 1.2 0.8 1.0 0.6 0.8 0.4 0.6 0.2 Var (nrom) 0.4 ∆ Var (Norm) 0.0 DP 0.2 PP -0.2 1 2 3 4 5 0.0 -0.4 Ramp segments 0 5 10 15 20 25 30 35 -0.2 -0.6 -0.4 -0.8 -0.6 -1.0 Force (N) Finger Force Variances over Ramp Trials
1.5 1.0 0.5 V 0.0 D -0.5 Elderly Subjects, Force Control Young Subjects, Force Control -1.0 Elderly Subjects, Moment Control Young Subjects, Moment Control -1.5 0 1 2 3 4 5 Segment of the Ramp UCM Analysis
A 10.0 Force when ∆V index crossed zero 40.0 Percentage of Force Ramp when ∆V index crossed zero B 35.0 8.0 DP 30.0 DP PP 25.0 Percent of Force Ramp 20.0 PP 6.0 15.0 Force (N) 10.0 5.0 4.0 0.0 Elderly Young 2.0 0.0 Elderly Young UCM Analysis
Force Ramps over Different Times to Different Levels Critical time varied Between 150 and 850 ms
During prehension tasks, total force is stabilized from the very beginning of the trial (critical time is zero) Ramp Force Production
Next Challenge: Are there timing synergies? If an element speeds up, will another one slow down to preserve an important timing feature of a general performance variable?
Task:Reach a certain level of total force at a prescribed time by pressing with several finger simultaneously. Questions: 1). Will individual force pulse magnitudes co-vary to preserve the peak magnitude of the total force? 2). Will the timings of the individual peak forces co-vary to preserve the timing of the total force? Methods:Comparison of actual and surrogate data sets (Means, SDs, and PCA).
200 Sensor FTOT(t) dFTOT(t) /dt Fpeak t tstart tpeak
(A) 5.00 4.00 3.00 2.00 ∆ Var (N2) 1.00 0.00 -1.00 0 10 20 30 40 50 60 70 80 90 10 (B) 0.15 0 0.10 0.05 0.00 Normalized ∆ Var 10 20 30 40 50 60 70 80 90 100 0 -0.05 -0.10 -0.15 Relative time from start to peak (%) A very quick synergy organization!
Result:There is negative co-variation among finger force magnitudes and positive co-variation among the timings of individual force pulses. There is a magnitude synergy and no timing synergy! Magnitude analysis Timing analysis SDA < SDS SDA > SDS
For the actual data set, there were only six cases (out of 80), when one of the PCs included both timing and magnitude variables significantly loaded (none for the first two PCs). In the surrogate set - 11 cases out of 20 for PC1-PC2.
Schöner’s Scheme Task Level [What to do and with what effector(s)] Timing Level [When to do and how quickly] Synergy Level [How to organize elemental variables] Force Level [Equilibrium-Point Hypothesis vs. EMG-Force Programming]