Download
1 / 13
230 likes | 703 Views
Z-Scores. Z-Score: It is a measure of a the position specific value in a data set relative to mean in terms of the standard deviation units. It is sometimes called the Standard Score. Value of 92 is 1.45 standard deviation units above the mean.

E N D
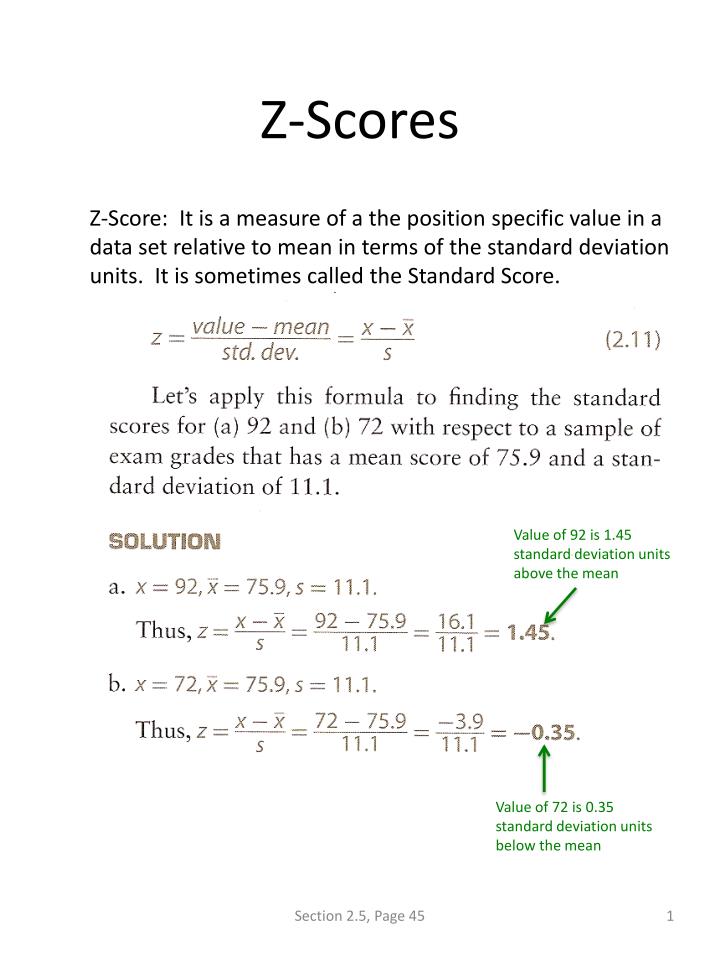
Z-Scores Z-Score: It is a measure of a the position specific value in a data set relative to mean in terms of the standard deviation units. It is sometimes called the Standard Score. Value of 92 is 1.45 standard deviation units above the mean Value of 72 is 0.35 standard deviation units below the mean Section 2.5, Page 45
Z Score Problems Shelia and Joan competed in two events at a track meet. In the long jump, Shelia’s jump was 0.5 meters above the mean of the group and Joan’s jump was 0.3 meters beyond the mean. The standard deviation was 0.25 meters. In the 100 meter run Shelia’s time was 5 seconds faster than the mean and Joan’s time was 8 seconds faster than the mean. The standard deviation was 3 seconds. Who had the best combined performance? Why? 2.50 Problems, Page 52
Normal Model Values on the x-axis extend from -∞ to + ∞. The total area under the curve equals 1.0.The area above any interval on the x-axis equals the percent of data values in the interval. Section 6.1
Normal Models Standard Normal Curve μ = 0, σ = 1 Section 6.1
Probabilities and Normal Curves To demonstrate the process of finding probabilities related to populations that can be described by a normal curve, let’s consider IQ scores. IQ scores are normally distributed with a mean of 100 and a standard deviation of 16. If a person is picked at random, what is the probability tat her IQ is between 100 and 115: that is, what is P(100<x<115)? Section 6.3, Page 124
Finding Areas with theTI-83 PRGM – NORMDIST 1 – ENTER 100 ENTER: Enters Lower Bound 115 ENTER: Enters Upper Bound 100 ENTER: Enters Mean 16 ENTER: Enters Standard Deviation Displays results: The area above the interval is .3257. Therefore the probability of selecting a person at random with an IQ between 100 and 115 is .3257 or 32.57%. Section 6.3, Page 124
Finding Areas with the TI-83 90 100 σ=16 Find P(x > 90) PRGM – NORMDIST – ENTER 1 – ENTER 90 ENTER 2ND EE99 – ENTER: On the TI 83, 2nd E99 = ∞ 100 – ENTER 16 – ENTER Display: P(x > 90) = .7340 Section 6.3, Page 125
Problems Problems, Page 133
Problems Problems, Page 133
Standard Normal CurveZ-Curve z-axis μ=0 σ=1 The standard normal curve or distribution is simply a normal distribution with a mean of 0 and a standard deviation of 1. The values on the horizontal axis are z-values. Before computers, all problems had to be converted to a standard normal distribution and then solved with tables in the book that relate the z-values to the areas above the intervals. Example: Find the area above the z-axis bounded by -1.5<z<2.1NORMDIST 1LOWER BOUND = -1. 5 UPPER BOUND = 2.1 Mean = 0 STANDARD DEVIATION = 1 Answer: AREA = .9153 Section 6.2, Page 122
Problems Problems, Page 132
Determine Data Values with TI-83 Suppose that in a large class, your instructor tells you that you need to be in the top 10% of the class to get an A. For a particular exam, the mean is 72 and the standard deviation is 13. (Assume a normal distribution) What grade is required for an A? Top 10% Area from the left = 1-.10=.90 Area = .10 μ = 72, σ = 13 Score = ? PRGM – NORMDIST – 2 .90 – ENTER 72 – ENTER 13 – ENTER Display: A test score of 88.66 or above is required to be in the top 10% Section 6.3, Page 125
Problems • 6.51 IQ scores are normally distributed with a mean of 100 and a standard deviation of 16. Find the following: • The 66th percentile. • The 80th percentile. • The minimum score required to be in the top 10%. • The minimum score to be in the top 25%. 6.52 Find the two z-scores that bound the middle 30% of the standard normal distribution. Problems, Page 133