Download
1 / 9
170 likes | 530 Views
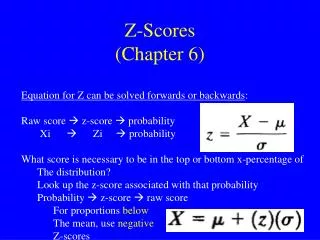
z-Scores. What is a z-Score? How Are z-Scores Useful? Distributions of z-Scores Standard Normal Curve. What is a z-Score?. A z-score is a standard score that measures distance from the mean in units of standard deviations. A standard score allows comparison of scores across distributions.

E N D
z-Scores • What is a z-Score? • How Are z-Scores Useful? • Distributions of z-Scores • Standard Normal Curve
What is a z-Score? • A z-score is a standard score that measures distance from the mean in units of standard deviations. • A standard score allows comparison of scores across distributions.
How are z-Scores Useful? • z-scores allow meaningful comparisons across different distributions. • z-scores allow us to make estimates of percentages above or below any point in a normal distribution.
How are z-Scores Useful? • Example: A client had a score of 16 on an achievement test and an IQ score of 110. • Are these scores consistent with each other? Is one score relatively higher than the other? • We can’t answer without standardizing.
How are z-Scores Useful? • If the achievement test has a population m of 24 and a population s of 4, then a score of 16 is two standard deviations below the mean, so z = -2.00. • If the intelligence test has a population m of 100 and a population s of 15, then a score of 110 is two thirds of a standard deviation above the mean, so z = +0.67.
Distributions of z-Scores • Any distribution, when converted to z-scores, has • a mean of zero • a standard deviation of one • the same shape as the raw score distribution
Standard Normal Curve • If a variable is distributed normally, converting all of the scores to z-scores results in a standard normal curve. • The shape of the standard normal curve allows us to estimate proportions of the curve above or below any z-score.
Standard Normal Curve • Really simple example of estimating a proportion from a normal curve: • Sam had an IQ score of 100 on a normally distributed IQ test with a m of 100 and s of 15. What is Sam’s percentile rank? • Because a normal curve is symmetrical, we know that 50% is below the mean, and because Sam’s score is at the mean, the percentile rank is 50%.
99% 95% 68% MEAN -3 -2 -1 +1 +2 +3