Download
1 / 27
290 likes | 707 Views
Z-Scores. Quantitative Methods in HPELS 440:210. Agenda. Introduction Location of a raw score Standardization of distributions Direct comparisons Statistical analysis. Introduction. Z-scores use the mean and SD to transform raw scores standard scores What is a Z-score?

E N D
Z-Scores Quantitative Methods in HPELS 440:210
Agenda • Introduction • Location of a raw score • Standardization of distributions • Direct comparisons • Statistical analysis
Introduction • Z-scores use the mean and SD to transform raw scores standard scores • What is a Z-score? • A signed value (+/- X) • Sign: Denotes if score is greater (+) or less (-) than the mean • Value (X): Denotes the relative distance between the raw score and the mean • Figure 5.2, p 141
Introduction • Purpose of Z-scores: • Describe location of raw score • Standardize distributions • Make direct comparisons • Statistical analysis
Agenda • Introduction • Location of a raw score • Standardization of distributions • Direct comparisons • Statistical analysis
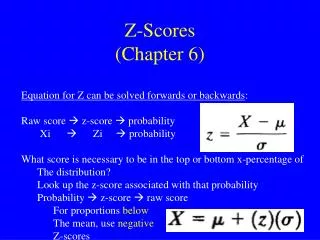
Z-Scores: Locating Raw Scores • Useful for comparing a raw score to entire distribution • Calculation of the Z-score: • Z = X - µ / where • X = raw score • µ = population mean • = population standard deviation
Z-Scores: Locating Raw Scores • Example 5.3, 5.4 p 144
Z-Scores: Locating Raw Scores • Can also determine raw score from a Z-score: • X = µ + Z
Agenda • Introduction • Location of a raw score • Standardization of distributions • Direct comparisons • Statistical analysis
Z-Scores: Standardizing Distributions • Useful for comparing dissimilar distributions • Standardized distribution: A distribution comprised of standard scores such that the mean and SD are predetermined values • Z-Scores: • Mean = 0 • SD = 1 • Process: • Calculate Z-scores from each raw score
Z-Scores: Standardizing Distributions • Properties of Standardized Distributions: • Shape: Same as original distribution • Score position: Same as original distribution • Mean: 0 • SD: 1 • Figure 5.3, p 145
Z-Scores: Standardizing Distributions • Example 5.5 and Figure 5.5, p 147
µ = 3 • = 2
Agenda • Introduction • Location of a raw score • Standardization of distributions • Direct comparisons • Statistical analysis
Z-Scores: Making Comparisons • Useful when comparing raw scores from two different distributions • Example (p 148): • Suppose Bob scored X=60 on a psychology exam and X=56 on a biology test. Which one should get the higher grade?
Z-Score: Making Comparisons • Required information: • µ of each distribution of raw scores • of each distribution of raw scores • Calculate Z-scores from each raw score
Psychology Exam Distribution: µ = 50 = 10 Biology Exam Distribution: µ = 48 = 4 Z = X - µ / Z = 60 – 50 / 10 Z = 1.0 Z = X - µ / Z = 56 - 48 / 4 Z = 2.0 Based on the relative position (Z-score) of each raw score, it appears that the Biology score deserves the higher grade
Agenda • Introduction • Location of a raw score • Standardization of distributions • Direct comparisons • Statistical analysis
Z-Scores: Statistical Analysis • Appropriate usage of the Z-score as a statistic: • Descriptive • Parametric
Z-Scores: Statistical Analysis • Review: Experimental Method • Process: Manipulate one variable (independent) and observe the effect on the other variable (dependent) • Independent variable: Treatment • Dependent variable: Test or measurement
Z-Scores: Statistical Analysis • Figure 5.8, p 153
Z-Score: StatisticalAnalysis • Value = 0 No treatment effect • Value > or < 0 Potential treatment effect • As value becomes increasingly greater or smaller than zero, the PROBABILITY of a treatment effect increases
Problems: 1, 2, 9, 17, 23 Textbook Problem Assignment