Download
1 / 13
140 likes | 240 Views
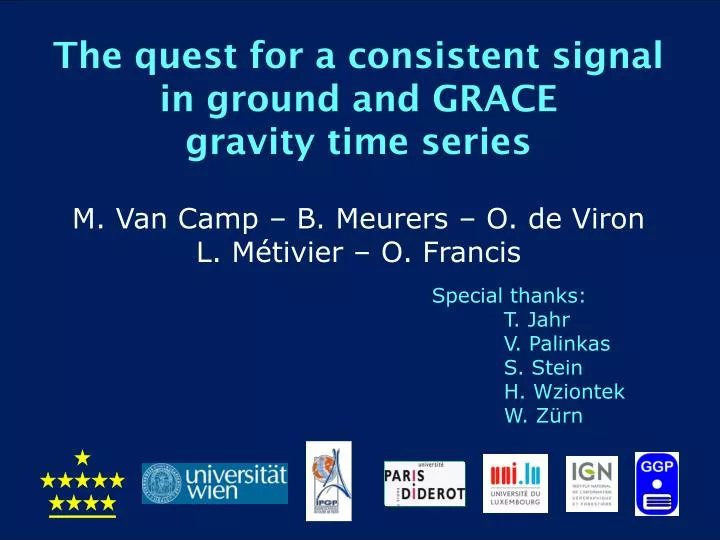
The quest for a consistent signal in ground and GRACE gravity time series M. Van Camp – B. Meurers – O. de Viron L. Métivier – O. Francis. Special thanks: T. Jahr V. Palinkas S. Stein H. Wziontek W. Zürn. Comparisons GRACE- superconducting gravimeters.

E N D
The quest for a consistent signal in groundand GRACE gravitytime series M. Van Camp – B. Meurers – O. de Viron L. Métivier – O. Francis Special thanks: T. Jahr V. Palinkas S. Stein H. Wziontek W. Zürn
Comparisons GRACE-superconductinggravimeters • 2 sources of information on gravitychanges : • GRACE & SuperconductingGravimeters Added value by combiningthem? Numerous publications : e.g. Abe et al., GJI, 2012 & Crossley et al., GJI, 2012.
What a land-based gravimeter “sees” • Point • measurement • 1 point is 1 km x 1 km (in the best case)
How to compare Gravimeters and GRACE ? In both cases: annual signal (not a surprise in geodesy) 40 nm/s² 4 µGal Here: superconducting gravimeter in Bad Homburg (DE) • Coherent between the gravimeters? • Coherent between gravimeters and GRACE?
To compare annual signals: phasor Maximum within 74 days (for stations experiencing large amplitude) What do we learn? Winters are wetter! Notice: even worse if the sign of underground stations is not inverted 74 days = 25 nm/s²
What about Gravimeters & GRACE ? Annual component • No agreement on annual : • Neither between SGs • Neither between SGs and GRACE • If agreement : so what?
Annual removed: Let us look at the interannual How? - EOF technique : common mode significant for 3 gravimeter series not better than random series Why?
Interannual BH MB BH MO WA PE CO WE ST VI MC CO MB MC MO PE ST • 11 on 45 pairs significantly correlated • (anticorrelated if underground-surface pairs) • Only little common signal • What can we do with it? WA VI WE 100 nm/s² 10 µGal
We find Nothing Is this strange? Disparate phases & amplitudes • Annual Similar Forcing (let us assume!) Complicated transfer function • Inter- • annual 10 on 45 gravimeter pairs significantly correlated http://www.cortjohnson.org/wp-content/uploads/2013/04/Complex-System-Gut.jpg
Correcting for local effects? • Need to convert gravimeter data to something that we can compare with GRACE : • Must know, by other means, the mass of water everywhere around the gravimeter. • Must rely on perfect hydrological models, • but what’s the extra value of comparing gravimeters to GRACE ?
Conclusions • We find the case that surface gravity and GRACE data are seeing the same signal to be weak • Poor correlations between the gravimeters themselves • True for the annual period • True for the inter-annual periods • Possible common, long period climate effects ? • Longer time series & More stations needed • SGs great for local hydrogeological investigations • GRACE great for large scale hydrogeological phenomena More? See Van Camp et al. GJI (in review)