Download

1 / 12
120 likes | 122 Views
Learn about z-scores, a common statistical method for standardizing data, and how they can be used to compare and analyze data points. Understand how z-scores relate to the mean and standard deviation, and how they can be converted back to raw scores. Discover the properties of the standard normal distribution and the 68-95-99.7 rule. Use z-scores to determine probabilities and make assumptions about data sets. Apply this knowledge to solve a sample problem involving SAT and ACT scores for college admissions.

E N D
What is a z score? “A common statistical way of standardizing data on one scale so a comparison can take place is using a z-score. The z-score is like a common yard stick for all types of data. Each z-score corresponds to a point in a normal distribution and as such is sometimes called a normal deviate since a z-score will describe how much a point deviates from a mean or specification point.” http://www.measuringusability.com/z.htm “The z score for an item, indicates how far and in what direction, that item deviates from its distribution's mean, expressed in units of its distribution's standard deviation.” http://www.sysurvey.com/tips/statistics/zscore.htm
Z score Is a way to standardize scores based on the mean. Tables are used to describe the areas under normal curves, associated with particular z scores. For instance, if Physics period 1 has an average test score of 74 and Physics period 7 had an average of 78 How does someone who had an 83 in period 1 compare with someone who had an average of 87 in period 7? Do they deserve the same grade? Both were substantially above average, although the grades were obviously quite different. Would the standard deviations of the two classes make a difference to you??
Z Score (cont) The conversion formula of a score to a z score is based on the mean and standard deviation. So what is the z score for someone whose score = the average?
Z score (cont) What about a z score for an x above the mean? What about a z score for an x below the mean?
Raw Score If you know the z score, it can be translated into the appropriate raw score by x = zσ + μ
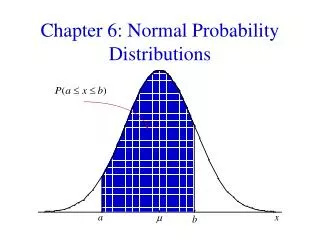
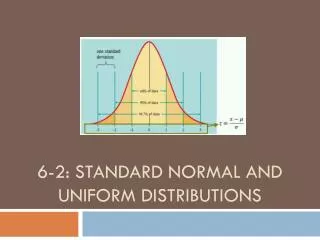
Standard Normal Distribution Standardizing a z score makes the center μ = 0. Standardizing a z score makes the spread σ = 1. The z distribution will be normal if the x distribution is normal. Areas still correspond as they did in 6-1. 68% of the area under the curve is 1 standard deviation from the mean. 95% of the area under the curve is 2 standard deviations from the mean 99.7% will be 3 standard deviations from the mean. This is sometimes called the 68-95-99.7 rule or The Empirical Rule
The college you want to apply to says that while there is no minimum SAT score required, the middle 50% of their students have combined SAT scores between 1530 and 1850. What would be a minimum acceptable ACT score that could be correlated to that same range of SAT scores? For college bound seniors, the average combine SAT is 1500 and standard deviation is 250. The ACT average is 20.8 with a standard deviation of 4.8
Why convert? If you can convert the raw score to a z score, you can use tables in the back to determine the area under the curve. Why? The areas under the curve is equal to the probability that the measurement falls in this interval. The textbook has a left tailed table. That is, the z score will correspond to a given cumulative area to the left of z. Therefore, what would be the area to the right of z? 1 – area left of z. (It could also be the opposite of the area to the left of –z)
What does this area stuff mean? Essentially if you have a z score, you can make an assumption about the % of scores (i.e. the probability) that fall at that number or below.
Some notes A z score of 6 or 7 would be highly interesting. Why? Calculator: normalcdf (zleft, zright) calculates the score between two z scores. If you need to do left or right of a z score, some books suggest using 3.49 for the end, some suggest 99. Use what you want.
ADD BVD PROBLEM Pg. 113