Download
1 / 18
180 likes | 365 Views
Road Network Upgrading And Overland Trade Expansion In Sub-Saharan Africa. Piet Buys Uwe Deichmann David Wheeler. Development Research Group. Nouakchott. Khartoum. Dakar. Niamey. Asmara. Bamako. N’Djamena. Banjul. Djibouti. Bissau. Ouagadougou. Conakry. Cotonou. Lome. Freetown.

E N D
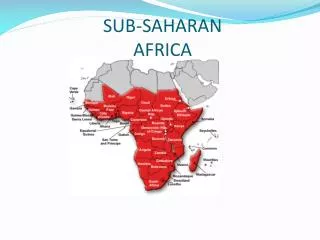
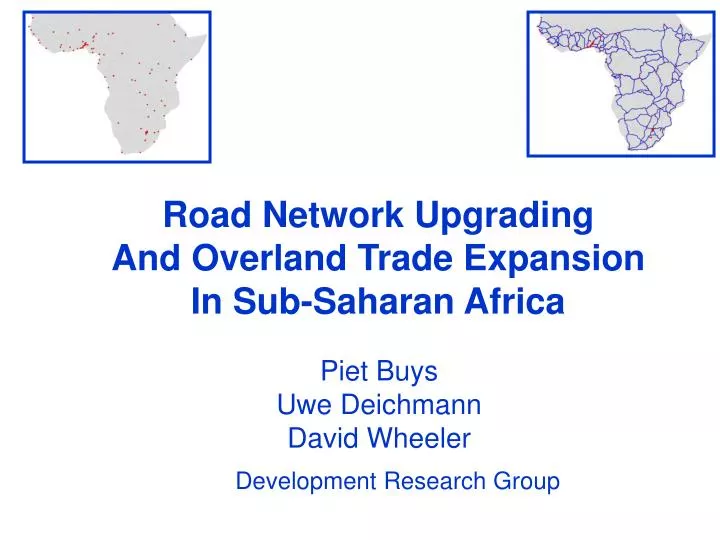
Road Network Upgrading And Overland Trade Expansion In Sub-Saharan Africa Piet Buys Uwe Deichmann David Wheeler Development Research Group
Nouakchott Khartoum Dakar Niamey Asmara Bamako N’Djamena Banjul Djibouti Bissau Ouagadougou Conakry Cotonou Lome Freetown Abuja Addis Ababa Monrovia Accra Bangui Yaoundé Abidjan Kampala Mogadishu Libreville Nairobi Kigali Brazzaville Bujumbura Kinshasa Dar es Salaam Luanda Lilongwe Lusaka Harare Windhoek Gaborone Pretoria Maputo Mbabane Maseru Sub-Saharan Africa: Continental Capitals & Cities>500,000 Population
Least-Distance Network: Total Length: 108,000 Km. 885 Road Segments 3,403 Connected City Pairs
Our “Resumé” PB, UD, DW Overland Travel
Road Network; Current Network Quality
Using The Network Model For Road Improvement Strategy Benefit – Cost Analysis for Network Upgrading at Different Scales: • Continental • Regional • National • Sub-National (data permitting)
Economic Scale (Population x Income Per Capita) = Benefits: Trade Flows Between Cities & Countries • Network Trade Factors • Economic Scale • Road Distance • Road Quality • Trade Agreements
Estimating Trade Flows: Econometric Analysis via Gravity Modeling Data Source: IMFDOT, 2000-2003 Sample Size: 1128 Observations Results: t-statistics in parentheses [** => 99% confidence]
Gravity Model Application: Projecting Network Trade Flows ($US) Program: Network Upgrade to Class 2 Road Quality Best 1 2 3 4 Worst 5
Gravity Model Application: Network Trade Flows ($US) Current Total for SSA: $10 Billion
Gravity Model Application: Upgraded Network Trade Flows ($US) Econometric Projection: $30 Billion
Program: Network Upgrade to Class 2 57.1 16.3 [+1 Std. Error] 30.4 [-1 Std. Error] Gravity Model Application: Network Trade Flows ($US) Econometric Projection: Annual Trade ($Billion) Upgraded Current 10.1
Cost: Econometric Analysis of Road Projects Program: Network Upgrade to Class 2 Road Quality Best 1 2 3 4 Worst 5
Data Source: World Bank ROCKS Database Sub-Saharan Africa: 470 Road Projects Costs in $US ‘000/Km. of Improvement
Cost Function Estimation Dependent Variable: Unit Improvement Cost Independent Variables: • Existing road condition (percent paved) • Wage (per capita income) • Governance (CPIA for accountability, corruption) • Rainfall (Daily mean for primary road network) • Regional controls (West, Central, East Africa) • Project type controls: • 7 Upgrading categories • 6 Maintenance categories
Program: Network Upgrade to Class 2 Econometric Projection: Upgrade Cost ($Billion) Upgrade Maintenance 28.4 15.6 [+1 Std. Error] 1.2 0.7 [+1 Std. Error] 20.7 0.9 [-1 Std. Error] [-1 Std. Error]
Network Upgrade Program: 5-Year Upgrade; 10-Year Operation