Download
1 / 57
570 likes | 624 Views
Sustainable/Green Water Resources Management. Prof. Dr. Phoebe Koundouri Head of Research Unit of Environmental & Natural Resource Economics ATHENS UNIVERSITY OF ECONOMICS AND BUSINESS Web Pages: http://www.aueb.gr/deos/gr/koundouri.html http://www.aueb.gr/deos/gr/akadhmaikoprosopiko.html

E N D
Sustainable/Green Water Resources Management Prof. Dr. Phoebe Koundouri Head of Research Unit of Environmental & Natural Resource Economics ATHENS UNIVERSITY OF ECONOMICS AND BUSINESS Web Pages: http://www.aueb.gr/deos/gr/koundouri.html http://www.aueb.gr/deos/gr/akadhmaikoprosopiko.html http://www.aueb.gr/pages/prosopiko/faculty_gr_short.php?facid=1094 E-mail: pkoundouri@aueb.gr NEW Website of the Research Unit of Environmental & Natural Resources Economics will be running on Monday at www.RENAR.aueb.gr
Never-ending process WFD:3 key principles An obligation of result Continuous transparency WFD, A MILESTONE IN EUROPEAN WATER POLICY
a general obligation: applies to all member-states applies to surface and groundwater a secondary goal:prevent deterioration of status Good status X • how to fill-in the potential gap between"business as usual" scenario and the goal? Business as usual X • update measures in order to reach the goal 2015 2003 achievement of less stringentenvironmental objectives extensions of deadlines AN OBLIGATION OF RESULT A compulsory goal: "good status of water" Actions to be defined with regards to the goal Limited possibilities for exemptions
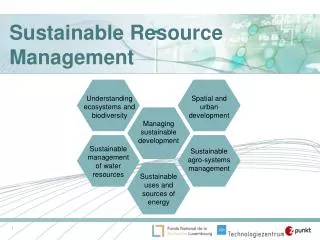
Underlining Concept: Sustainable Development Sustainable development (SD) is a pattern of resource use that aims to meet human needs while preserving the environment so that these needs can be met not only in the present, but also for future generations.
Triple goal of SD overspace (i) and time (t) • Environmental/ Ecological Sustainability (ecosystem resilience, resource-specific equilibrium) • Economic Sustainability (economic efficiency by economic sector) • Social Sustainability (affordability & equity by income group)
Where do economics come in? • Articles 5: Socio-Economic characterization of RB • Article 9: cost-recovery and allocation • Annex III: guidance for economic analysis, program of measures & CBA
WFD: A Manual of Implementation 3-step economics approach Economic characterization of the river basin Step 1 The assessment of the recovery of the costs of water services Step 2 The economic assessment of potential measures for balancing water demand & supply Step 3
Step 1:Economic characterization of the riverbasin & identification of significant issues Step1_A. Evaluation of the economic significance of water inthe region. Step1_B. Identification of key economic drivers influencingpressuresand water uses. Step1_C. How will these economic drivers evolve over time & howwill they influence pressures? Step1_D. How will water demand and supply evolve over time & which problems their paths arelikely to cause? Construct Baseline Scenario Time & Money Constraints Define the Detail of Step 1!
Step1_A. Evaluate the Economic Significance of Water Uses in the Region • Residential (e.g. population connected to public water supply system, population with self-supply, number of water supply companies, etc.). • Industrial (e.g. turnover for key sub-sectors, employment in sectors, etc.) • Agricultural (e.g. total cropped area, cropping pattern, livestock, gross production, income, farm population, etc.) • Tourism (e.g. total number of tourist days, daily expense per tourist day, employment and turnover in the tourism sector, etc.) • Health Related Services • Environmental and Ecosystem Services
Step1_B. Identify Key Economic DriversInfluencing Pressures and Water Uses • General socio-economic indicators and variables (e.g. population growth, income, employment). • Key sector policies that influence significant water uses (e.g. agricultural and environmental policies). • Production or turnover of main economic sectors/ significant water uses. • Implementation of planned investments linked to existing regulation, likely to affect water availability. • Implementation of future (environmental and other) policies likely to affect water uses.
Step1_C. Evolution of Economic Drivers & their Influence on Pressures • Changes in demographic factors, e.g. population growth in specific urban areas. • Economic growth and changes in economic activity composition, e.g. changes in the relative importance of services/sectors. • Changes in land planning, e.g. new areas dedicated to specific economic activities, etc. • Changes in social values and policy drivers, e.g. globalization. • Changes in natural conditions, e.g. climate changes. • Changes in non-water sector policies, e.g. changes in agricultural policy or industrial policy that will affect production and consumption in economic sectors. • Planned investments in the water sector, e.g. for developing water services, for restoring the natural environment/mitigating for damage caused by given water uses. • Development of new technologies likely to impact water use for industrial production and related pressures. Trend variables Critical Uncertainties Water Policy Variables
Step1_D. Evolution of Demand and Supply - Evaluation of spatial and dynamic availability of significant water bodies. - Apply appropriate methodologies to assess sector-specific water demand. Anthropocentric Values Structure & Processes Environmental Functions Human Benefits Environment Use Non-Use Values Values
Market Failure Environmental resource is a Public Good Not explicitly traded in any market No market price exists to reveal TEV (Hidden demand). We need to retrieve TEV via WTP Non-market Valuation Methods
Estimating Demand in Step1 i. Identification of Sector Water Demands in the Watershed Area Households Industry Agriculture Environment ii. Valuation Techniques for Specific Types of Water Demand Use Value Non-use Revealed preference methods (indirect methods) Hedonic Pricing Method Travel Cost Method Averting Behaviour Method Residual Analysis (Production Cost Method) Existence & Values for others: Contingent Valuation Methodology Choice Experiments: Field, Lap Meta-Analysis Method Methods not strictly based on economic welfare Replacement Cost Methods Restoration Cost Methods
Hedonic Valuation Method (HVM) • A resource can be defined in terms of services it yields or an `attribute' it embodies. This attribute may be embodied in other goods or assets which are marketed, and which do have observable prices. Using these prices you can derive economic value. • E.g: Farm prices in an area with good groundwater are most likely higher than in an area without either ground- or surface water. Comparing differences in farm prices across a region and controlling for other influences, then the difference in prices of these farms would lie in groundwater access. • Problems: • Only capable of measuring the subset of use values that people are WTP for through the related market. • If consumers are not fully informed about the qualities of the attributes being valued, hedonic price estimates are of little relevance.
Travel Cost Method (TCM) Infers the value of a set of attributes from expenditure (time and money spent on the trip) on outdoor recreational facilities or visits to nature reserves. E.g: Valuing the effects on the demand for recreation of a change in water quality in a river. Problems: - Capable of measuring the subset of values that people are WTP for in the related market. - Very few applications outside resource-based recreational amenities. - Data-intensive. - What value should be assigned to time costs of travel? - Statistical problems & sample bias.
Averting Behavior Method (ABM) Use of expenditures undertaken by households that are designated to offset an environmental risk, in order to infer WTP for avoiding environmental degradation. E.g: Use of water filters. Problems: - Limited to cases where households spend money to offset environmental hazards. - Insufficient studies to comment on convergent validity.
Residual Analysis Method (RAM) • Values all inputs for the good produced at their market price – except for the water itself. The remaining value of the good, after all other inputs are accounted for, is then attributed to the water input. • E.g: Valuing water as an input in production of different crops. • Problems: • Only part of use-value of water can be captured. • Market imperfections can bias valuation estimates.
Contingent Valuation Method (CVM) • CVM relies on a constructed, hypothetical market to produce monetary estimates of value. The value of an environmental resource to an individual is expressed as: • - Maximum Willingness-to-Pay (WTP) • Minimum Willingness-to-Accept (WTA, Compensation) • E.g:Conduct survey to obtain peoples’ bids (either WTP or WTAC) for a specified change in the quality of water in a river, contingent upon the description of a hypotheticalmarket where water quality is traded. • Problems: • Interviewing bias - Non-response bias • Strategic bias - Yea-saying bias • Hypothetical bias - Information bias
Choice Experiment Method (CEM) CEM is a survey-based technique which can estimate the total economic value of an environmental stock/flow or service and the value of its attributes, as well as the value of more complex changes in several attributes. E.g: Each respondent is presented with a series of alternatives of the environmental stock/flow or service with varying levels of its price and non-price attributes and asked to choose their most preferred option in each set of alternatives. Problems: - Simplified version of reality … but CEM eliminates or minimises several of the CVM problems (e.g. strategic bias, yea-saying bias, embedding effects).
Operational at the policy level? Question:How can these methods be made operationalin the context of thedevelopment of groundwater managementstrategies at the policy level? Answer:Recent years have seen a growing interestin the potential for producinggenerally applicable models for the valuation of non-market environmental goods and services, which do not rely uponexpensive and time-consuming original survey work, but ratherextrapolate results from previous studies of similar assets. This approach is called meta-analysis for the use and non-use valuesgenerated by environmental resources.
Meta-Analysis Method (MAM) • Meta-analysis is the statistical analysis of the summary of findingsof empirical studies: i.e. the statistical analysis of a largecollection of results from individual studies for the purpose of integrating the findings. • E.g: Freshwater fishing meta-analysis of valuation studies. • Meta-analytical research seems to have been principally triggered by: • Increases in the available number of environmental valuation studies. • - Seemingly large differences in valuation outcomes as a result of use of different research designs.
Environmental Benefits-Transfer • Transposing monetary environmental values estimated at one site (study site) to another (policy site). • Values must be adjusted to reflect site specific features. • When time or resources are limited, this provides an alternative to conducting a valuation study. Using meta-analysis for benefits transfer has advantages. E.g: Environmental Valuation Reference Inventory (www.evri.ca) Problems - May involve bias - Validity and reliability issues
List of case studies on water-valuation from my research team Direct use values: Irrigation for agriculture PF, RC, MP Domestic and industrial water supply PF, RC, MP Energy resources (hydro-electric) CV Transport and navigation CV Recreation/amenity HP, TC, CVM, CEM Wildlife harvesting CEM Indirect use values Nutrient retention RC Pollution abatement RC Flood control and protection RC, CEM Storm protection RC, PF External eco-system support RC, CEM Micro-climatic stabilisation PF, CEM Reduced global warming RC, CEM Shoreline stabilisation RC, CEM Soil erosion control PF, RC, CV, CEM
List of case studies on water-valuation from my research team Option values Potential future uses of direct and indirect uses CVM, CEM Future value of information of biodiversity CVM, CEM Non-use values BiodiversityCVM, CEM Cultural heritageCVM, CE Bequest, existence and altruistic values CVM, CE
Methodology for Constructing Baseline Scenario Using Parameters from in Step 1 1 • Consider three possibilities of evolution of population. • Consider two possibilities of evolution of demography of other cities in the region. • Consider possible evolution of rural population. 2 Build scenarios using basic assumptions and quantify the water balance with these assumptions. 3 Apply step two over time. 4 Based on steps 1,2,3, imagine a plot that tells the story of the system from now until at least 2030, giving consistency to the assumptions and water balance curves.
Water Balance/ ‘Good Water Status’ gap Initial status 2003 2015 2021 How to apply the ‘Baseline scenario’? Measures to close the gap are needed! Starting from initial status it is possible to elaborate a baseline scenario. The baseline scenario refers to the situation without doing anything else than planned today. Date at which ‘Water Balance’ should be met.
Step2:Assess Cost-Recovery of Water Services Step2_A. How much do current water servicescost? Step2_B. Who pays these costs? Step2_C. What is the current cost-recovery level? Step2_D. Propose cost-recovery mechanisms.
Step2_A&B. Current cost of services Who pays for these costs? Estimate costs of water services by sector. Do users and/or institutional mechanisms recover these costs? ENVIRONMENTAL COST RESOURCE COST FINANCIAL COSTS TOTAL ECONOMIC VALUE CAPITAL COST OPERATION & MAINTENANCE (O&M) COST RESOURCE ADMIN COST FORGONE VALUE OF ALTERNATIVE USES (present/future) EXTERNAL COST OF WATER QUALITY REDUCTION COST OF WATER ABSTACTION PAID BY USERS Analysis per use: Households, Tourism, Industry, Agriculture, Ecosystem, etc. per RBD
Step2_C. Current cost-recovery level. Elements to be investigated: • Status of key water services (e.g. number of persons connected). • Costs of water services (financial, environmental & resource costs). • Institutional set-up for cost-recovery (e.g. prices and tariff structure, direct & indirect subsidies, cross-subsidies). • Contribution from key water uses to the recovery of costs. • Resulting extent of cost-recovery levels, linked with the affordability for water users.
Βαθμός Ανάκτησης Κόστους ανά Υδατικό Διαμέρισμα
Βαθμός Ανάκτησης Κόστους Ύδρευσης Ανά Υδατικό Διαμέρισμα
Βαθμός Ανάκτησης Κόστους Άρδευσης ανά Υδατικό Διαμέρισμα
Step2_D. Identify potential cost-recovery mechanisms/Green Investments? Potential cost-recovery mechanisms: • Pricing • Tradable permits • Quotas • Taxes/subsidies • Direct Controls • Educational/Awareness Campaigns • Voluntary Agreements • Legal Instruments, etc. Green Investments in: • Pollution Control and Remediation • Resource Conservation and Management • Land Use and Infrastructure • Renewable Energy Sources
Step3:The economic assessment of potentialmeasures for reaching good water status Step3_A. Identify least-cost set of measures. Step3_B. Assessment of cost of measures. Step3_C. Assessment of the impact of measures on economicsectors/uses. Step3_D. Are costs of measures disproportionate?
Step3_A. Search for Least-Cost Set of Measures COST EFFECTIVENESS OF PACKAGE OF MEASURES: • Economic instruments (e.g. abstraction/pollution taxes, tradable permits, subsidies). • Measures to increase awareness regarding water scarcity, aiming at reducing abstraction/pollution. • Direct controls on pollution dischargers. • Agri-environment programs providing financial and technical assistance for, e.g. reallocation of crop production mix over agricultural land, adoption of water-saving technologies coupled with land-allocation restrictions, etc. • Green Investments
Classification of Economic Instruments Economic Instrument Advantages Disadvantages 1. Standards and Quotas Not economically efficient 2. Water abstraction charges Adjustment of price signals to reflect actual resource costs; encourage new technologies; flexibility; generation of revenues Low charges will have minimal impact on user behavior and will continue in resource over-utilization; Difficult to police 3. Pollution charges Same as water abstraction charges; polluter-pays principle Same as water abstraction charges 4. Subsidies on water saving measures Readily acceptable Financial Constraints 5. Tradable permits Quantity based targets that are able to attain least-cost outcome. Allows flexibility. May entail high transaction costs 6. Voluntary agreements Readily acceptable 7. Liability legislation Assess and recover damages ex-post but can also act as prevention incentives Require an advanced legal system; high control costs; burden of proof Needs High Env Awareness
Step3_B. Assessment of Cost of Measures - Estimate a range of costs along with key parameters influencing costs over time (cost change with developments in sectors). - Allocate costs of measures to water users and identify winners and losers, in order to potentially feed into the analysis of disproportionate costs to justify derogation (Step3._D).
Step3_C. Impact of Measures on Key Economic Sectors/Uses • Net impacts on public expenditures and revenues: e.g. • impacts on expenditures for agri-environment schemes • revenues of economic instruments • impacts of changes in the prices charged for publicly owned water services. • Wider economic and social impacts: e.g. • significant changes in patterns of employment • economic impacts on industries & local economic development from changes in the price of water supply, level of discharges and water quality. • Effects on the retail price index and inflation.
Important for budget-constrained developing countries! Step3_D. Disproportionate Costs/Derogation Disproportionality • If the achievement of good water status has significant adverse effects on the wider environment & human activities. • If the beneficial objectives served by the artificial or modified characteristics cannot reasonably be achieved by other means. Measures to improve water quality are expensive Heavily Modified Water bodies Water bodies substantially changed in character as a result of physical alterations by human activity. Time derogation Less stringent objectives • !! Disproportionality is a political judgment informed by economic information: CBA • - Disproportionality does not begin when measured costs exceed quantifiable benefits. • - The margin of excess costs should be appreciable & have a high level of confidence. • Disaggregated analysis to the level of separate socio-economic groups and • sectors is needed, especially if the ability to pay is an issue for a particular group.
Step3_D. CBA: Cost-Benefit Analysis Cost Benefit Analysis (CBA) is an economic tool for government policy and investment project analysis used widely. Can incorporate environmental impacts of policies/projects within CBA to correct for market failure “Social” appraisal of policies and projects, carried out by aggregation of benefits from, and costs of a policy/project over individuals and over time Welfare theoretic underpinning: Economic efficiency with a temporal dimension
CBA Steps • Stage 1: Definition of policy/project: • The reallocation of resources being proposed • The population of gainers and losers being considered • Stage 2: Identification of policy/project impacts: • Define all impacts that will result from policy/project implementation • Consider additionality (net impacts) and displacement (crowding out)
CBA Steps • Stage 3: Identification of economically relevant impacts: Environmental impacts of a policy/project are relevant in CBA if either • They change the utility of at least one person in the society • They change the quantity or quality of the output of some positively valued commodity Stage 4: Physical quantification of relevant impacts: • Determine physical amounts of costs and benefits and when they occur in time • Use environmental impact analysis to estimate the impact of policy/project on the environment • Estimations will be made with uncertainty, calculate the expected value of costs and benefits
CBA Steps • Stage 5: Monetary valuation of relevant effects • All physical measures of impacts should be valued in common units to be comparable • Common unit = money • CBA analyst must • Predict prices for value flows extending into the future • Correct market prices where they are distorted • Calculate prices where non exists using environmental valuation methods
CBA Steps Stage 6: Discounting of costs and benefits: • Once costs and benefits are expressed in monetary units they should be converted to present value terms by discounting • PV= Xt[(1+r)-t] where X= cost or benefit; r = discount rate; [(1+r)-t] discount factor; t= time • The higher the value of t the lower the discount factor • The higher the discount rate for a given t the lower the discount factor
CBA Steps • Stage 7:Applying the net present value test: • Apply NPV test to choose those policies and projects that are efficient in terms of their use of resources • Where Bt = benefits of the project at period t, Ct = the costs of the project at period t, r = the discount rate, n = the number of years over which the project will operate • NPV is the present value of the project’s/policy’s net benefit stream, obtained by discounting the stream of net benefits produced by the project/policy over its lifetime, back to its value in the chosen base period, usually the present. • If NPV>0 accept policy or project (Based in Kaldor-Hicks Criterion) since it would improve social welfare
Is Discounting so straight forward? ‘Humanity has the ability to make development sustainable: to ensure that it meets the needs of the present without compromising the ability of future generations to meet their own needs.’ WCED, 1987 ‘There is something awkward about discounting benefits that arise a century hence. For even at a modest discount rate, no investment will look worthwhile.‘ The Economist (1991), March 23, p 73. In the decade since that comment in The Economist, the nature of the problem with long-run discounting has become clearer.
The Need for Time Declining Social Discount Rate… There are powerful reasons for choosing a declining social time preference rate. This conclusion is supported by robust recent theoretical work, which has taken several different approaches to the subject. Although there is a paucity of empirical evidence on the pattern of that rate's decline, it may be better to use those data, which are available rather than to continue practicing discounting with non-declining rate in the long term. The data best suited the policy-makers' need were produced by Newell & Prizer (2003) and Koundouri et al (2005).