Understanding the Impact of Renewables on Seabird Foraging Habitats
330 likes | 437 Views
This research explores the mechanisms by which mobile marine predators, such as fish, birds, and mammals, capture prey. Through the integration of advanced acoustic monitoring technologies like EK60 multi-frequency echosounders and multibeam sonar, the study aims to identify essential habitat characteristics needed for successful foraging. The findings will provide insights into how renewable energy developments may influence marine predator populations on various spatial scales and inform future ecological and governmental policies.

Understanding the Impact of Renewables on Seabird Foraging Habitats
E N D
Presentation Transcript
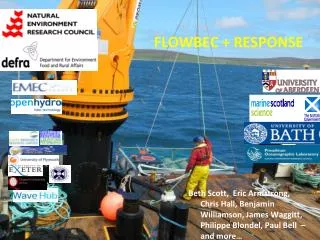
FLOWBEC + RESPONSE Beth Scott, Eric Armstrong, Chris Hall, Benjamin Williamson, James Waggitt, Philippe Blondel, Paul Bell – and more…
NERC / DEFRA projects on the potential impact of renewables RESPONSE DOWNWARD FACING acousticsEK60 multi-frequency + Observers to define seabird foraging habitat. FLOWBEC Creating new UPWARD FACING instrument with EK60 multi-frequency + Multibeam sonar to capture prey and seabird behaviour
FLOWBEC & RESPONSE research projects: • The research in these projects attempts to understand the exact mechanisms involved in how mobile marine predators (fish, birds and mammals) capture their prey. This allows us to understand in detail what sort of physical habitat characteristics these animals need to be present to successfully forage. • Will be able to predict on a range of spatial scales how renewable developments may effect individuals – and cumulative effects up to population
A top-down view of the frame showing the relative positions of the MBES, MBES control housing and MBES battery bank. The approximate (un-calibrated) mounting orientation of the Scanmar inclination sensor (used during deployment only) and the inclination sensor (logged throughout the survey) are both shown.
Each battery housing contains a pair of 12V 220Ah SLA batteries as shown on the left. The right figure shows the two high current charge lines, the two low current output connectors, the three position charge-off-output switch and the vent plug
Pitch and roll varied by less than 1° over the course of the deployment
Multi Beam Slide by Philippe Blondel and Benjamin Williamson
Ek60 Initial Results High velocity flow - large turbulence structures (with echo) Low velocity flow – fish schools?
Output FLOWBEC :Technical • ECUA paper now published on POMA: Williamson, B.J., Blondel, P., Multibeam imaging of the environment around marine renewable energy devices, IOA 11th European Conference on Underwater Acoustics (ECUA 2012), Edinburgh, Scotland, Jul 2012. http://dx.doi.org/10.1121/1.4772810 • Overview technical design (draft in progress) FLOWBEC – The design and deployment of a self-contained acoustic monitoring platform for mapping the environment around marine renewable energy devices. • Processing of MBES data (draft in progress) Multibeam imaging and acoustic analysis of the environment around marine renewable energy devices.
Output FLOWBEC: Ecological Post-doc and PhD – working on cleaning data and defining turbulence/noise signals so to be able to remove [mostly done] – so can see clearly fish and bird behaviour. • Processing of EK60 data (upon BW transfer to Aberdeen) Multi-frequency echosounder analysis of the environment, fish, diving seabirds and turbulence around marine renewable energy devices. • Data integrationIntegrating multibeam sonar, multi-frequency echosounder, marine X-band radar and bird observation data to map the environment around marine renewable energy devices. • New PhD joint with Prof Vladimir Nikora at UoA (fluid dynamic engineer) to use Turbulence data to define turbulence characteristics - for understanding animals usage and potential for design of turbine blades
RESPONSEforaging habitat: how to define? • Species specific habitat use? (fish, birds and mammals) • physical characteristics quantified? • NOTE – results presented in Response preformed by James Waggitt (PhD, Aberdeen) ALBANa Mara Marine Scotland Science
Mean numbers vs prevalence(few very high counts) (how often seen in location) 5 years of on-shore survey data
Use of zig-zag survey technique against the tidal flow Speed of tide will determine speed over ground and area/ volume of water sampled Sampled range of differentturbine types and depths
Foraging distributions (A) all seabirds (B) black guillemots n=231 (C) Atlantic puffins n=823 (D) common guillemots n=275
RESPONSE research projects: • The surface features that visual animals may use to identify areas of foraging such as roughness, convergent areas, shear lines. Surface features may also bias the visibility of marine animals to observational counts and we are performing analyses to correct for these biases.
Radar: Fine scale flow and 3-D habitat characteristics(Paul Bell, NOC, POL)
Locations of convergence/divergence & shear from MIKE 21 2-D data
EK60 facing downwards from vessel: detects prey and turbulence Sub-surface Turbulence associated with water boils (kolks) Fish Shoal
Depth of turbulence at different directions of the tideFlood Ebb
Difference in turbulence around turbinestop increasing ebb, bottom max flood
Why is it important to Government policy /Developers / Energy Companies? • can predict physical effects of renewable developments on the oceanographic environment, • Therefore if we can link animal behaviour to physical aspects of the oceans, we can more accurately predict what (if any) the effects of renewable developments will have on the foraging success of marine animals. • Foraging success drives population dynamics as it controls adult and juvenile survival. • Short term, highly focused studies can lead to a rapid increase in our understanding and the research may ultimately allow us to separate the effects of any large scale renewable developments from climate change effects.
Output FLOWBEC + RESPONSE • 1) Detection issues – correction factors for fast water habitats • 2) habitat characteristics - what are the most important physical variables in tidal sites (and wave sites?) . • 3) What level of detail is needed to define – visual, acoustics,Mike21, radar? • 4) Risk of collision by understanding / quantified foraging behaviours in tidal (and wave sites?) – fish, birds, mammals? • 5) Large/far scale potential cumulative effects on populations of mobile predators
Mean number of actively foraging birds Black GuillemotDiving bird(Across wider range of tidal states and within relatively more laminar flow) Habitat TIDAL SPEED Artic Tern Surface feeder(mainly ebb tides and in habitat with boils & shear ) Habitat IE MaxE DE IF MaxF DF TIDAL SPEED