Download
1 / 33
360 likes | 766 Views
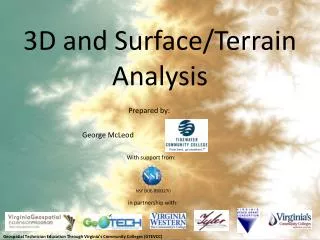
3D and Surface/Terrain Analysis. Prepared by:. George McLeod. With support from:. NSF DUE-0903270. in partnership with:. Geospatial Technician Education Through Virginia’s Community Colleges (GTEVCC). . D. Digital Terrain Models.

E N D
3D and Surface/Terrain Analysis Prepared by: George McLeod With support from: NSF DUE-0903270 in partnership with: Geospatial Technician Education Through Virginia’s Community Colleges (GTEVCC)
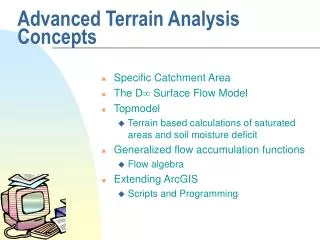
D Digital Terrain Models • A digital terrain model is a model providing a representation of a terrain relief on the basis of a finite set of sampled data • Terrain datarefers to measures of elevation at a set of points V of the domain plus possibly a set E of non-crossing line segments with endpoints in V
Data Sampling • Regular • Irregular
Our three Primary terrain Models • Digital Elevation Models (DEMS) – aka Regular Square Grids (RSGs) • Triangulated Irregular Networks (TINS) – aka Polyhedral terrain models • Contour Maps – aka “topo” maps
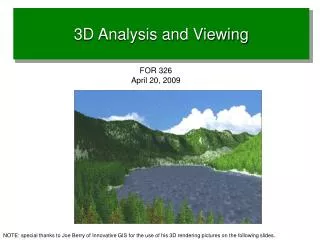
TIN The Data… DEM LIDAR (LIght Detection And Ranging)
Introduction to the Data • Terrain mapping • Land surface is 3-D • Elevation data or z-data is treated as a cell value or a point data attribute rather than as a coordinate.
Digital Elevation Model (DEM) • Gridded array of elevation points obtained from a variety sampling methods
D DEMs A constant function can be associated with each square (i.e., a constant elevation value). This is called a stepped model (it presents discontinuity steps along the edges of the squares)
The function defined on each square can also be a bilinear function interpolating all four elevation points corresponding to the vertices of the square
Triangulated Irregular Network (TIN) • Series of non-overlapping triangles • Elevation values are stored at nodes • Sources: DEMs, surveyed elevation points, contour lines, and breaklines • Breaklines are line features that represent changes of the land surface such as streams, shorelines, ridges, and roads
TINs • Example of a TIN based on irregularly distributed data
Data for Terrain Mapping and Analysis • Triangulated Irregular Network (TIN) • Not every point in DEM is used • Only points most important • VIP (Very Important Points) algorithm • Maximum z-tolerance algorithm • Delaunay triangulation: all nodes are connected to their nearest neighbor to form triangles which are as equi-angular as possible.
Needs larger storage capacity Computationally difficult Flexibility of data sources Can add points Better display More efficient Needs smaller storage capacity Computationally simpler Fixed with a given cell size Cannot add sample points Raster display Less efficient DEM TIN Tins vs. Grids
Contour Mapping • Contouring is most common method for terrain mapping • Contour lines connect points of equal elevation (isolines) • Contour intervals represent the vertical distance between contour lines. • Arrangement of contour lines reflect topography
Digital Contour Maps Contours are usually available as sequences of points A line interpolating points of a contour can be obtained in different ways Examples: polygonal chains, or lines described by higher order equations
Digital Contour Maps: properties They are easily drawn on paper They are very intuitive for humans They are not good for complex automated terrain analysis
Contour Profile Mapping • Vertical profile shows changes in elevation along a line, such as a hiking trail, road or stream.
Cartographic Terrain Mapping • Hill shading is also known as a shaded relief or simply shading • Attempts to simulate how the terrain looks with the interaction between sunlight and surface features. • Helps viewers recognize the shape of land-form features on a map.
Hillshading • Four factors control the visual effect of hill-shading • Sun’s azimuth is direction of incoming light (0 to 360°) • The sun’s altitude from horizon (0-90°) • Surface slope (0-90°) • Surface aspect (0 to 360°)
Hypsometric Tinting • Hypsometric tinting • Applies different color symbols to represent elevation or depth zones.
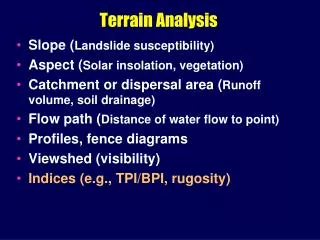
Methods of Analysis • Slope measures the rate of change of elevation at a surface location • Aspect is the directional measure of the slope (degrees- 4 or 8 directions) • Hillshade, refer to previous slides • Line of sight refers to the straight line visibility from an observer to a feature • Viewshed analysis refers to the areas of the land surface that are visible from an observation point or points. • Watershed analysis refers to an area that drains water and other substances to a common outlet. • Area andvolume calculations
Connectivity Function Example:Viewshed Analysis Image Source: Chrisman, Nicholas.(2002). 2nd Ed. Exploring Geographic Information Systems. p 198. fig. 8-14.
Hillshade Setting a hypothetical light source and calculating the illumination values for each cell in relation to neighboring cells. It can greatly enhance the visualization of a surface for analysis or graphical display. Azimuth 315°, altitude 45°
Viewshed • Viewshed identifies the cells in an input raster that can be seen from one or more observation points or lines. • It is useful for finding the visibility. For instance, finding a well-exposed places for communication towers hillshaded DEM as background
Application: Environmental Impact Analysis 3D landscape model impact on natural beauty
Application - Flood Risk 3D height data changing water levels-danger areas
The 3rd Dimension: Height Analysis – combining several methods together • Contours • Hill shading • Spot height symbols • Cliff & slope symbols • Viewpoint symbols
3D Terrain Analysis: Summation • GIS does not always provide exact answers to problems, but by identifying trends based on geography, GIS can reveal patterns that can help us make informeddecisions. • A GIS can improve decision-making; it cannot make decisions for us.