Download
1 / 52
530 likes | 773 Views
Terrain Analysis. by Ayse Kilic with some materials from David G. Tarboton , Utah State University and from ESRI software. Learning Objectives. Calculation of slope on a raster using ArcGIS method based in finite differences D8 steepest single flow direction (8 direction pour model)

E N D
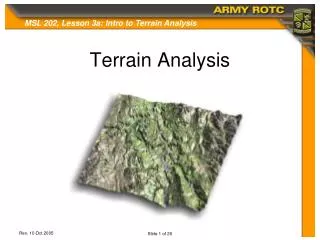
Terrain Analysis by Ayse Kilic with some materials fromDavid G. Tarboton, Utah State University and from ESRI software
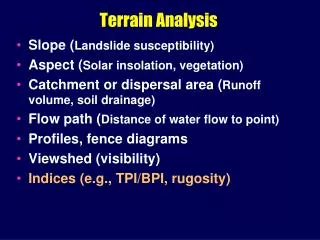
Learning Objectives • Calculation of slope on a raster using • ArcGIS method based in finite differences • D8 steepest single flow direction (8 direction pour model) • D steepest outward slope on grid centered triangular facets
Spatial Surfaces used in Hydrology Elevation Surface — the ground surface elevation at each point -- Expressed as a Digital Elevation Model for Gridded Data
National Elevation Dataset (NED) http://ned.usgs.gov/ Scientists and resource managers use NED data for global change research, hydrologic modeling, resource monitoring, mapping and visualization applications. • Serves the elevation layer of The National Map, • Provides basic elevation information for earth science studies and mapping applications in the United States.
Digital Elevation Model with 1 arc-second (30m) cells Seamless in 1° blocks for the United States 10 billion data Derived from USGS 1:24,000 quadrangle sheets composed of the best available raster elevation data of the conterminous United States, Alaska, Hawaii, territorial islands, Mexico and Canada. National Elevation Dataset (NED) http://ned.usgs.gov/ http://nationalmap.gov/viewer.html
The NED are derived from diverse source data that are processed to a common coordinate system and unit of vertical measure. • These data are distributed in geographic coordinates in units of decimal degrees, and in conformance with the North American Datum of 1983 (NAD 83). • All elevation values are in meters and, over the continental United States, are referenced to the North American Vertical Datum of 1988 (NAVD 88). • The vertical reference will vary in other areas. • NED data are available nationally (except for Alaska) at resolutions of 1 arc-second (approx. 30 meters) and 1/3 arc-second (approx. 10 meters), and in limited areas at 1/9 arc-second (approx. 3 meters).
Measuring in Arc-Seconds • Some USGS DEM data is stored in a block that utilizes 1/3, one, three, five, or thirty arc-seconds of longitude and latitude to register cell values. • The geographic reference system treats the globe as if it were a sphere divided into 360 equal parts called “degrees”. • Each degree is subdivided into 60 minutes. • Each minute is composed of 60 seconds. • An arc-second represents the distance of latitude or longitude traversed on the earth's surface while traveling one second (1/3600th of a degree). • At the equator, an arc-second of longitude approximately equals an arc-second of latitude, which is 1/60th of a nautical mile (30.87 meters).
The planet Earth is about 13,000 kilometers (8000 miles) in diameter and 40,000 kilometers (25,000 miles) in circumference.
Measuring in Arc-Seconds • At the equator, an arc-second of longitude approximately equals an arc-second of latitude, which is 1/60th of a nautical mile (30.87 meters). • Arc-seconds of latitude remain nearly constant, while arc-seconds of longitude decrease as one moves toward the earth's poles. • At 49 degrees north latitude, along the northern boundary of the United State, an arc-second of longitude equals • 30.87 meters * (cos 49°) = 30.87*0.6561 = 20.250 meters.
3-D detail of the Tongue river at the WY/Montana border from LIDAR. LIDAR from aircraft or from the ground can provide amazing detail on elevation, including individual tree heights and hydraulic channels Roberto Gutierrez University of Texas at Austin
Topographic Slope 900m Ridge Ridge with the contour lines • Topographic slope can be determined from a DEM • Used to determine how (quickly) water flows downhill and concentrates into streams 896m 892m 888m 884m 880m 876m valley 872m
Topographic Slope 900m Ridge • The watershed is defined as the area where all flow lines flow to the same local stream. • Flow lines always flow perpendicular to contour lines • By definition, the ‘ridge’ is a boundary for the watershed because north of the ridge, water flows to a different stream. 896m 892m Watershed boundary 888m 884m 880m 876m valley 872m stream
Topographic Slope 900m Ridge • There are three alternative sets of inputs (choose one) • Surface derivative z (dz/dx, dz/dy) • Vector with x and y components (Sx, Sy). Slope in x and y direction. • Vector with magnitude (slope) and direction (aspect) (S, ) 896m 892m 888m 884m 880m 876m valley 872m
ArcGIS “Slope” tool • Calculates for each cell • Calculates the maximum rate of change in value from that cell to its neighbors • Represents the rate of change of elevation for each digital elevation model (DEM) cell (slope). Slope is the first derivative of a DEM • The lower the slope value, the flatter the terrain; the higher the slope value, the steeper the terrain.
Definition of X, Y, and Z in 3D space Z axis is the direction that elevation changes (up or down) Origin is the location of the point of interest (pixel or grid cell) Y axis is the direction that Y has a changing value (North-South in ArcGIS) X axis is the direction that X has a changing value (East-West in ArcGIS) X, and Y are horizontal distances Z is the vertical distance The X, Y, Z axes are at right angles to one another
Slope Handout http://snr.unl.edu/kilic/gisrs/2017/Slope.pdf Determine the length, slope and azimuth of the line AB.
Slope: A line in 3D space A • The simplest way to think about slope is to consider two points in a three dimensional space and a line that connects them. • Suppose there are two such points, A and B, and they have coordinates (xa, ya, za,) and (xb, yb, zb,). • The vector AB can also be thought of as having two components, a rise, which represents the vertical difference, dz, between the two points, • and a Run = , which represents the horizontal distance between them. • With these definitions, the actual length of the line AB, that considers the change in elevation, is given by B
Blue line is driving distance = 1.6 miles Yellow line is actual distance Example of distance and slope from Hardin Hall to Nebraska Hall A B Hardin Hall: 696308.68 m E 4522333.41 m N Z = 355 m amsl 2267.138 m =1.34 miles Nebraska Hall: 694149.90 m E 4521640.89 m N Z = 352 m amsl
Definition of Slope (degrees or %) ) (0) * 100 (%) Runis the horizontal distance calculated using X and Y Riseis the vertical distance calculated using Z (elevation) Slope ranges (-900, +900) or (-infinity %, +infinity %)
For the previous example, the three expressions for slope are: 1 2 3 ) = ArcTan(0.001323) = 0.0760 * 100 = 0.001323*100 = 0.1323% Runis the horizontal distance calculated using X and Y Riseis the vertical distance calculated using Z (elevation) Slope ranges (-900, +900) or (-infinity %, +infinity %)
Special Cases ) (0) * 100 (%) When the angle () is 45 degrees, the rise is equal to the run, and the percent rise (slope) is 100 percent When the slope angle ) approaches vertical (90 degrees), the percent rise (slope) begins to approach infinity. Runis the horizontal distance calculated using X and Y Riseis the vertical distance calculated using Z (elevation)
a b c d e f g h i ArcGIS “Slope” tool y Calculates slope for each cell. In this illustration, it is for Cell “e” For each cell, the Slope tool calculates the maximum of the rate of change in value from that cell to each of its eight neighbors The rate of change in the x direction for cell eis calculated with the following algorithm x The rate of change in the y direction for cell eis calculated with the following algorithm c b f a e i d h The negative sign in front of the equations is because x increases to the right (east) and y increases to the north. Now dz/dx is + if z increases with increasing x (to the east). g x y see next slide for derivation of equation
Explanation of Previous Equations The two equations for dz/dx and dz/dy are simplified from the first equation below. The basis for that equation is illustrated in the Figure and represents an average of central finite differences over each of the three rows of cells, with the middle row counting twice as it appears in averages on each side. = - c b f a e i d h g x y The negative sign in front of the equations is because we are computing uphill slope
Definition of Azimuth The orientation of the land surface is defined by its aspect, which is analogous to the azimuth used in land surveying = Azimuth, angle defined as degrees clockwise from North Y axis is the direction that Y has a changing value (South to North in ArcGIS) This is my grid cell location X axis is the direction that X has a changing value (West to East in ArcGIS)
Definition of Azimuth Solve for α by Inverting the Tangent Function (ArcTan) = Azimuth, angle defined as degrees clockwise from North The other way to write ArcTan is Tan-1 Azimuth= Convert from radians to degrees (180/π) Azimuth is the angle between North and any desired direction you want to travel
ArcGIS Aspect – the steepest downslope direction If I pour water on the ground, which direction does it flow? Aspect is the azimuth associated with the steepest downhill slope when we are facing downhill. Therefore, we use slopes instead of distances in the tangent function. In Arc, with grid cells it is easiest to calculate Aspect using the ratio of slopes (dz/dx) and (dz/dy). = Aspect Here, we are ‘looking down from above’
a b c 30 d e f 145.2o 80 74 63 69 67 56 g h i 60 52 48 Example for topographic slope Mesh spacing=30 m Slope/Aspect at cell e? (elevation decreases in east direction) (elev. increases in north direction) Note that this is the slope in Uphill direction (it is a positive number) Converts slope from m/m to degrees (180/π)
a b c 30 d e f 145.2o 80 74 63 69 67 56 g h i 60 52 48 Example for Aspect Mesh spacing=30 m Aspect at cell e? -34.8o One more adjustment: The above Aspect is in the direction of increasingelevation (an increase in dz with distance). We need to add 180o to this calculated aspect to get the direction of decreasingz (i.e., the steepest downhill slope)
The Atanfunction is multivalued on the full circle and only unique in a range of 180 degrees. To unambiguously determine the direction from two components you really need the atan2 function that keeps the sign on y and x components separately.For example, let y = y component of a vectorx = x component of a vectoratan(x/y) gives the direction of the vector as an angle (with the ratio x/y since angle here is measured from north). But x/y is the same value if y is positive and x negative, or x positive and y negative. So once you take the ratio x/y, if you get a negative number you do not know which (y or x) was negative.A way to resolve this isangle = atan(x/y)if(0 < angle < 180 and dz/dx < 0) then aspect = angle + 180 (flip the direction because dz/dx is negative)else aspect = angleendif
In reality, in a gridded system, water can only flow to one of eight adjacent cells 32 64 128 16 1 8 4 2 • D8 steepest single flow direction • (Eight Direction Pour Point Model) The direction of flow is determined by the direction of steepest descent: Maximum_drop= (change_in_z-value / distance) * 100 This is maximum percentage drop. Defined as “Hydrologic slope” in ArcGIS ESRI Direction encoding (ArcGIS)
80 80 74 74 63 63 69 69 67 67 56 56 60 60 52 52 48 48 Hydrologic Slope (Flow Direction Tool) Find Direction of Steepest Descent (ArcGIS) 30 30 Slope: Slope: For diagonal direction, the denominator for slope includes square root of 2
? Limitation due to 8 grid directions. The “true” flow direction follows the red arrow. However, we can only choose one of the blue arrows because we have to use one of eight adjacent cells.
The D Algorithm (optional) Tarboton, D. G., (1997), "A New Method for the Determination of Flow Directions and Contributing Areas in Grid Digital Elevation Models," Water Resources Research, 33(2): 309-319.) (http://www.engineering.usu.edu/cee/faculty/dtarb/dinf.pdf)
The D Algorithm z2 z3 zo z1 If 1 does not fit within the triangle, the angle is chosen along the steepest edge or diagonal resulting in a slope and direction equivalent to D8
30 80 74 63 69 67 56 60 52 48 284.9o 14.9o D∞ Example z3 z2 z4 z5 zo z1 z6 z8 z7 The tool is available at http://hydrology.usu.edu/taudem/taudem5/documentation.html
Automating Processes using Model Builder Using a DEM tif file as input The orange boxes are Arc tools
Elevation Contours for Wood River Valley Watershed of Upper Klamath Lake Basin
Slope (%) for Upper Klamath Lake Basin, OR (-infinity, + infinity)
32 64 128 16 1 8 4 2 Flow Direction Integer raster whose values range from 1 to 255 What is the direction of 208? Raster value of 256 is the same as 1 (towards East)
Hillshade Hypothetical illumination of a surface by determining illumination values for each cell in a raster. It does this by setting a position for a hypothetical light source (sun) and calculating the illumination values of each cell in relation to neighboring cells. Azimuth The azimuth is the angular direction of the sun, measured from north in clockwise degrees from 0 to 360. An azimuth of 90º is east. The default azimuth is 315º (NW). Altitude The altitude is the slope or angle of the illumination source (sun) above the horizon. The units are in degrees, from 0 (on the horizon) to 90 (overhead). The default is 45 degrees.
Viewshed The locations that are visible from a viewer location. Line of sight analysis. Useful for cell coverage and visual exposure analyses From http://www.innovativegis.com/basis/mapanalysis/Topic15/Topic15.htm
ArcGIS.Com ready to use maps including elevation services http://www.arcgis.com/features/maps/earth.html Elevation Land Cover Soils