Download
1 / 32
320 likes | 486 Views
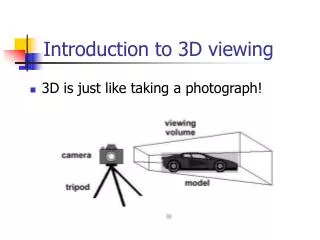
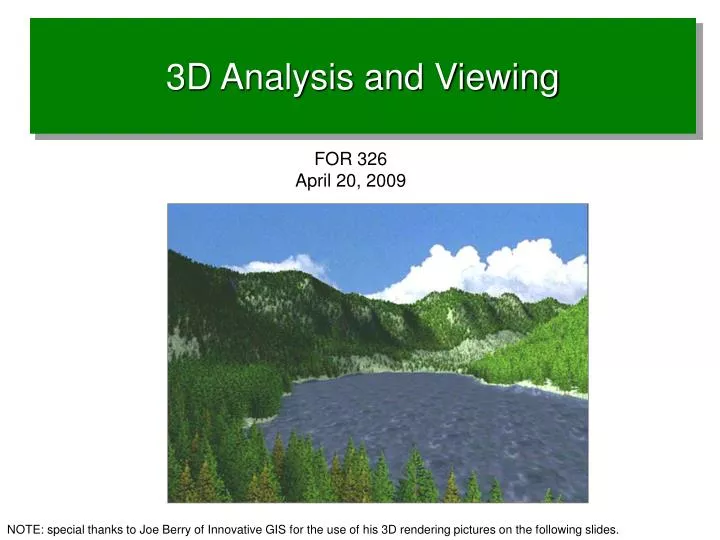
3D Analysis and Viewing. FOR 326 April 20, 2009. NOTE: special thanks to Joe Berry of Innovative GIS for the use of his 3D rendering pictures on the following slides. Virtual reality. Integration of existing technologies Commercial GIS software has limited capabilities for

E N D
3D Analysis and Viewing FOR 326 April 20, 2009 NOTE: special thanks to Joe Berry of Innovative GIS for the use of his 3D rendering pictures on the following slides.
Virtual reality Integration of existing technologies • Commercial GIS software has limited capabilities for realistic 3-D visualization • Scientific visualization software is readily available but at individual plot/stand level only • Virtual reality techniques are increasingly used in computer games and film making. Non-traditional GIS visualization techniques • Multimedia mapping (linking video/photos to maps) • 3-D object rendering (trees, soil, buildings) • Map animation (2-D and 3-D)
3D Visualization Approaches Image Draping-- is an established technique in GIS. Draping a topographic or thematic map onto a 3-D terrain surface is effective but relies on abstract colors, shading and symbols. “Map Abstraction”
3D Visualization Approaches Geometric Modeling--builds a scene of realistic features, such as trees, from a given viewpoint based on GIS inventories of tree types and densities. “Virtual Reality”
3D Rendering: Tree Design …1) 3-D object design (trees) The Tree Designer is used to build custom 3-D tree symbols that represent forest components, such as different species, multi-age trees, seasonal effects, shrubs, and snags 3-D trees with several sun angles are created and stored as bit mapped images for polygon rendering
Landscape Visualization (Rendering) “laying the carpet” Step 1) 3-D Terrain Surface Step 2) Polygon Containers Step 3) Surface Texture Step 4) Tree Objects Step 5) Final Composition Step 6) Atmospheric Effects “Pouring the Trees”
Landscape Visualization (Rendering) Tree Designer …each tree is sized for distance from view point 1573 • Species Mix • Tree Symbols • %Maturity • #Trees 1658 …Tree type and % Maturity sets tree symbol; #Trees for how many Stand exam files
Visualizing forest conditions …changing the landscape’s carpet and objects to simulate different conditions Before Fire After Fire Summer After Snowfall Winter
Setup to use the 3D analyst extension • Load the extension Also a good idea to have the spatial analyst extension loaded as well.
Setup • Add the 3D analyst toolbar to the ArcMap interface
Setup • Set the options for working directory, analysis mask, extent, cell size
Creating surface models with grids and TINs • The “backbone” of all 3D analysis and viewing • Grids are raster features represented by evenly spaced cells • TINS (triangular irregular networks) grid TIN
TIN data structure • The detail can be improved by increasing the number of triangle and node vertices TIN with fewer vertices More vertices
TINs • Usually created from vector data sources (points, lines, polygons) • Need a z value (elevation value) from the vector sources • You can create a TIN all at once or in stages to make refinements
Contour NOTE: the height of the contour is written to the status bar
Line of sight Green = visible along line of sight Red = hidden along line of sight Endpoints result
3D Viewing: First start ArcScene • Can be started from the start button (Start button -> Programs -> ArcGis -> ArcScene) Or • Started from the 3D analyst toolbar
Draping an image over a surface • Add a TIN (preferred) or grid elevation surface to ArcScene • Add an image (DOQQs work well) to ArcScene • Set the layer properties of the image to use the elevation values from the surface as the base heights In this case, my elevation surface is called tin4 These layer properties are being set on the Doqq
Result • Image will be drawn in a 3d perspective
Navigate Fly Zoom in Zoom out Pan Full Extent Zoom in/out Set observer Zoom to target Center on target Narrow field of view Expand field of view Getting around • Use the toolbar options to zoom, fly, pan, tilt, etc.
Other options • Drape streams over the image by using the DEM or TIN as the base height surface • Set an offset to see streams better
3D effects and animation • Add additional toolbars to create mpeg movies of flyovers
Other options • Using base heights of buildings added to surface
Using base heights of buildings • Make sure buildings or any feature are digitized and attributed with a height • Use the height or Z value of each building added to the surface height