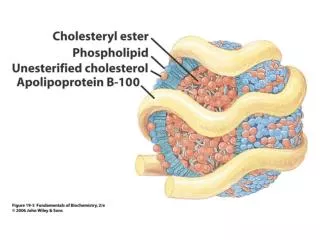
Download
1 / 8
80 likes | 192 Views
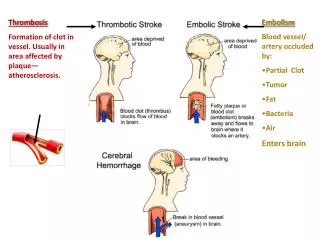
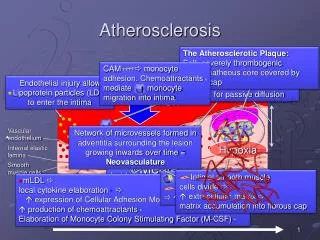
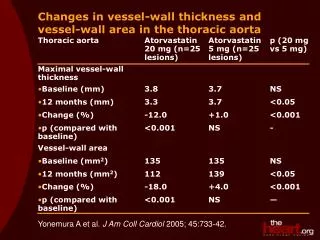
Imaging the vessel wall in atherosclerosis. Lindsay and Choudhury , Nature Reviews: Drug Discovery 2008, 7: 517-29. Atherosclerosis regression on statins – wall imaging with MRI. @12 Months Vessel wall area Aorta decrease ~ 8% Carotid decrease ~ 15% Lumen Area Aorta unchanged

E N D
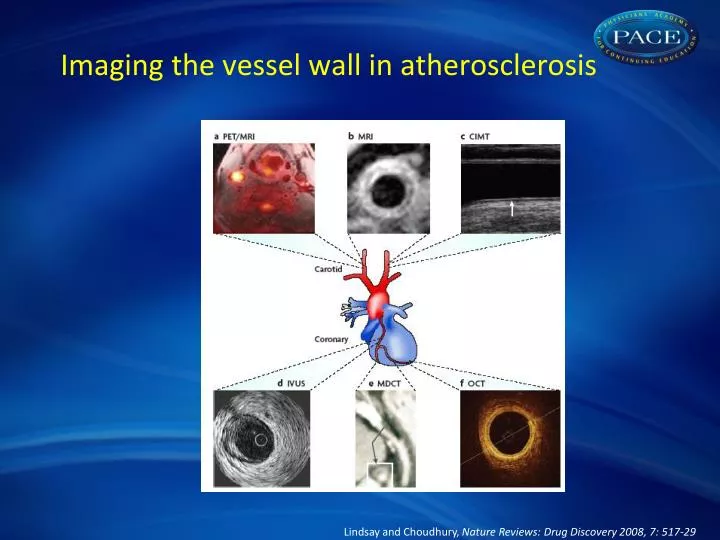
Imaging the vessel wall in atherosclerosis Lindsay and Choudhury, Nature Reviews: Drug Discovery 2008, 7: 517-29
Atherosclerosis regression on statins – wall imaging with MRI @12 Months Vessel wall area Aorta decrease ~ 8% Carotid decrease ~ 15% Lumen Area Aorta unchanged Carotid unchanged Max Thickness Aorta decrease ~ 9% Carotid decrease ~ 11% Corti R et al. Circulation, 2001;104: 249-252 5
Plaque composition analysis t = 0 t = 0 t = 2y T1WToFPDWT2W ~40 patients with US-defined carotid artery stenosis. Randomised to rosuvastatin 5mg vs 20-40 mg / day No change in overall plaque burden BUT In patients (n=16) with lipid rich core – regression of core over 24 months Underhill et al. AHJ, 2008;155:584:e1-8
Effect of nicotinic acid on atherosclerosis progression when added to statin therapy Established atherosclerosis and HDL-c < 1mmol/L All treated with statins Randomised to placebo or Niaspan 375mg for 1wk > 500mg for 1 wk > 750mg for 1 wk > 1000mg for 4 wks > 1500mg 4 wks > 2000mg maintenance Primary end point = change in carotid wall area at 12 months Week 7 LFTs, CK Week 15 LFTs, CK INDIVIDUAL PARTICIPATION COMPLETED SCREENING 6 MONTH REVIEW MRI FASTING BLOODS BASELINE MRI FASTING BLOODS 12 MONTH REVIEW MRI FASTING BLOODS
Effect of nicotinic acid on atherosclerosis progression Change in carotid wall area (mm2) Placebo Nicotinic acid * *p=0.03 (mixed effect model adjusted for baseline covariates) estimated treatment difference [95% CI] = −1.64mm2 [−3.12, −0.16] Lee JMS et al; J Am CollCardiol, 2009;54:1787-94
Dal-PLAQUE: design • A double-blind, randomized, placebo (S.O.C.)- controlled, parallel group,multi-center (11 sites) study in 130 patients with CHD or CHD equivalent 189 patients screened 130 Treated (1:1 allocation) randomisation First patient screened Feb 2008Last patient randomised Nov 2008 Double-blind treatment period Subjects allocated to dalcetrapib 600 mg/day (n=64) or placebo (n=66) for 24 months Recruitmentn=189 subjects screened TBR >1.6-inflammation present by a central core lab 12 months -3 months 0 months 6 months 24 months 3-month PET/CT 6-month PET/CT* Baseline PET/CT at screening 6-month MRI Baseline MRI 2 wk before randomisation 24-month MRI* 12-month MRI *Primary Endpoints Change in arterial wall 18F-FDG uptake (target to background ratio) within the index vessel (left/right carotid or ascending aorta) after 6 months Structural changes in the arterial wall (total vessel area, wall area, wall thickness, normalised wall index) based on the average of the right and left carotids after 24 months* Fayad ZA et al. Am Heart J. 2011
Dal-PLAQUE: MRI (24 months) and PET (6 months) outcomes SE = standard error *After adjustment for baseline and centre†Total number of patients with MRI vessel parameter measurements was 56 for placebo and 58 for dalcetrapib‡Total number of patients with target-to-background ratio measurements was 56 for placebo and 56 for dalcetrapib. **For upper limit of 90% CI for placebo-corrected change from baseline Nominal P-values