Download
1 / 26
260 likes | 356 Views
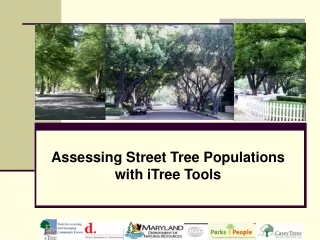
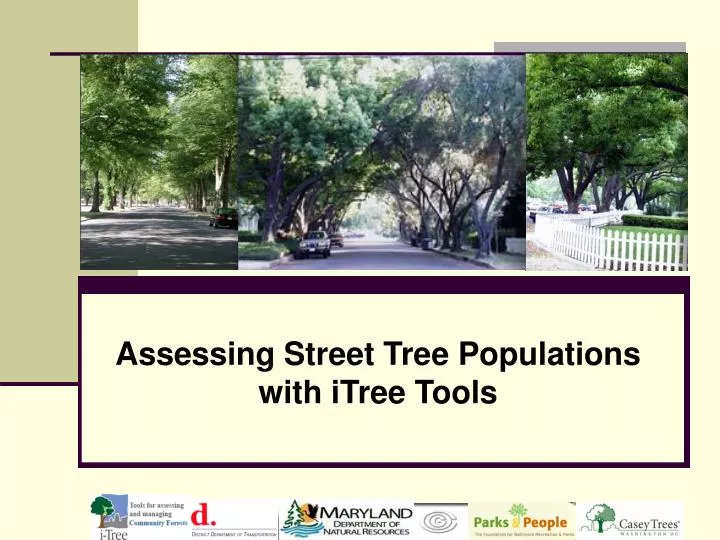
Assessing Street Tree Populations with iTree Tools. Communicating STRATUM results . Who is client? What do they want to know? What do you want to tell them? Report functions Use in client reporting Use beyond client reporting. Know the client and client’s needs.

E N D
Communicating STRATUM results • Who is client? • What do they want to know? • What do you want to tell them? • Report functions • Use in client reporting • Use beyond client reporting
Know the client and client’s needs • Remember the “Prior to data collection” section…? • Identify the client • Identify the assignment • STRATUM has a LOT of reporting options; providing all may not be helpful • What did the client ask you to find out? • What else did you find out?
Know the client and client’s needs • Examples of clients and needs • Client: Mayor • Assignment: Quantification of ecosystem services • Client: City forestry department • Assignment: Report on present tree condition and maintenance needs • Client: NGO • Assignment: Report on stocking levels and enhancement opportunities for planting projects • What you report on should be based on your client and their needs (!)
Custom analysis example • You want to plant large trees wherever possible (AVPSL) in order to maximize ecosystem services BUT… • You want to minimize costs for maintenance and conflict to maximize cost : benefit, so… • Custom query: Sp Code = AVPSL AND WIRE CONFLICT => 2; in results, count and/or replace AVPSL with AVPSM or AVPSS
Disclose methods, filters • “GIS Desktop project of the study area was created in Arc Map and exported to a Windows Mobile handheld device. The mobile GIS was used in concert with a Garmin 76C GPS unit to locate study segments in the field. Data on trees were recorded using the iTREE software and data on segments were recorded using Arc Pad mobile GIS” • “Street tree stocking was estimated based on biophysical possibility with allowance for a tree every 30’…” • “Utility conflict was defined as any tree part touching any overhead line…”
Hyattsville example • Assignment • The purposes of this report are to: • Describe the current street tree population generally; • Identify current stocking levels of and planting opportunities for street trees; • Report on the costs for and benefits provided by Hyattsville’s street trees, including quantification of the ecosystem services provided by those trees; • Identify green and gray infrastructure conflicts; • Make recommendations on management of the assessed trees; and, • Provide detailed information for the parties (DNR and Hyattsville) to use in communicating with partners and constituents regarding management decisions related to the trees.
Hyattsville overview • The City of Hyattsville is a municipality in Prince George’s County, MD • Situated inside the Capital Beltway • Land area of 6.4 km2 (2.5 sq mi) • Population of 14,733
Plot scheme/density • 100 selected • 5 discarded • Data collected on 95 plots • For communities with less than 50,000 persons, sample size is 6% of total street miles • We sampled approx. 18% of segments and approx. 17% of road miles
Planting • Typical site: planting strip (75.5%) in a single or multi-family residential (88.5%) neighborhood • The total number of potential planting sites: 7,700 • Total street trees: 2,900 • Stocking level is 38% • To put it another way, there is room for approximately 2.6 times the number of street trees in Hyattsville presently • Total opportunity: 4,800 potential plantings sites • Over 83% of planting sites have a tree lawn wide enough to accommodate a large tree. However, > 55% of these have OHW. In most such cases, smaller scale trees are more appropriate in order to avoid maintenance conflicts
Tree management • Only 0.3% of all sites had a stump present • No maintenance or routine maintenance recommended for over 80% of trees • No critical safety concerns were observed • Only 3.8% of trees had immediate management needs • Most common: sycamore (26.7%) and callery pear (26.7%) • The treatment recommended for majority of trees: no treatment (37.95%) • Cleaning most frequently recommended treatment (30%), followed by reduction (18.21%) which was recommended primarily to alleviate conflicts with overhead utilities. Raising (2.05%) for vehicular and pedestrian clearance was not a significant issue and again points to the effectiveness of the tree management program
Terms and conditions (!) • This document is a work for hire produced by the author for the Department of Natural Resources (“the Department”). The field inspections were made throughout the summer of 2007. All references (pictorial and text) are true and accurate representations of conditions found on the sites on those dates. • The tree condition data reported were created based on cursory observation. No detailed tree risk assessments were performed. The intent of this report is to provide a “snapshot” of the entire population rather than to provide specific information regarding any of the individual trees reported on. The Department will make all raw data available to the client in the event that they want to perform follow up assessments on any of the trees included in the survey. • The conclusions and recommendations are based on the author’s experience and education as a qualified professional, and are not intended as a predictor of future conditions. This work is intended as a tool to assist the tree owner in making an educated tree management decision rather than to dictate a management action.
Gray infrastructure conflicts • No sidewalk heaving: 80% • Low (13.9%), medium (4.4%), and high (1.5%) heaving occurred related to the remaining trees • Species associated with the most severe heaving were pin oak, southern red oak, and silver maple • No OHW found on 54% of sites • On 21.5% of sites, lines were present but were not in conflict with the tree • On 24.1% of sites, conflicts were observed • Three species most commonly in conflict were callery pear, willow oak, and red maple • Likely at least partially attributable to the fact that they among the most prevalent species found on Hyattsville’s roadsides
Ecosystem services (cont.) • The cost: benefit ratio is 0.90. Does not compare favorably with the ratios found in other US cities such as: • NYC (5.06) • Fort Collins, CO (2.18) • Glendale, AZ (2.41) • Charlotte, NC (3.25) • Disparity is likely due to the following: • Differences in energy costs in the other cities • Species selection differences • High per tree maintenance $$ in Hyattsville • Low overall tree population in Hyattsville
Recommendations • Expand tree planting program, beginning with identification and prioritization of candidate sites • Maintain or increase diversity at the species, genus, and family levels • Plant the largest tree possible at a given site in order to maximize benefits; however, do not create grey infrastructure conflicts (cost: benefit ratio) • Cease planting callery pear cultivars and plum. Consult technical resources to identify suitable alternate species • Continue to manage for safety • Maintain current custom of minimizing critical concerns via rapid response • Maintain current custom of grinding stumps shortly after removal
Use beyond client reporting • Chesapeake Bay UTC goal • SWM report
Use beyond client reporting • Clean Air Act compliance • Baltimore and Washington, DC have included trees in SIP for ozone non-attainment under EPA 8-hour standard in 2007 • Air quality (ozone) report
Use beyond client reporting • GHG strategies • RGGI • Other carbon accounting / climate change initiatives • Energy, carbon reports
Communicating STRATUM results Maryland Department of Natural Resources