Download
1 / 9
90 likes | 99 Views
Regression allows us to summarize the relationship between the variables. What is the average effect for the participants?. Average Effect = β 10. Average Baseline Level = β 00. Issues to Keep in Mind.

E N D
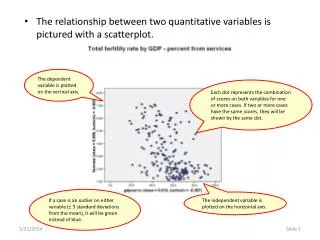
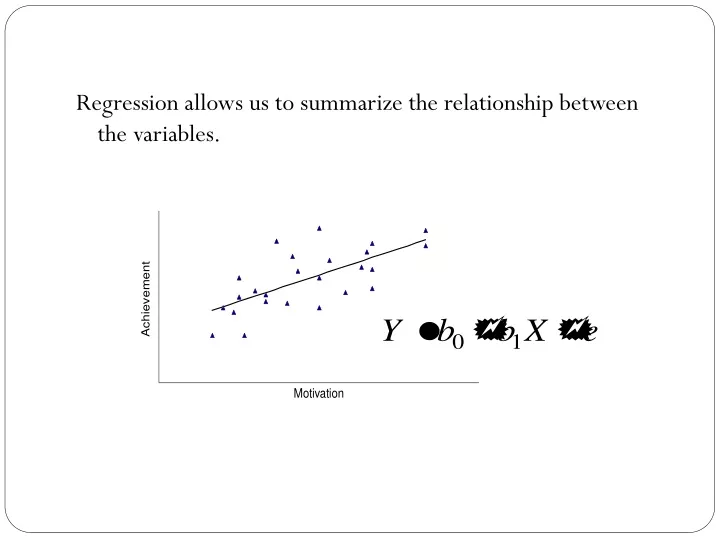
Regression allows us to summarize the relationship between the variables.
What is the average effect for the participants? Average Effect = β10 Average Baseline Level = β00
Issues to Keep in Mind There needs to be a match between the trajectory specified in the model and what is seen in the data Effect = b1? This seems incorrect
What is seen may require specification of a complex growth trajectory Do you think specification tends to be easier when there are more or less observations in a phase?
Using Multilevel Models to Analyze Data from Small-N Designs:The easy, the difficult, and the impossibleDavid RindskopfCUNY Graduate CenterWith the assistance ofWill Shadish UC MercedEden NaglerCUNY
(Long-term) Project Goals • Develop methods for analyzing small-N designs using modern statistical methods • Compare results to simpler methods, including intra-ocular traumatic test usually performed • Solve (mostly unanticipated) technical problems of analyses • Develop methods for combining across multiple studies (meta-analysis)
Background to Project • Will and I: Members of What Works Clearinghouse Technical Advisory Group • Emphasis on studies with group comparisons, random assignment to groups • School psychology student at CUNY, Sasha Collins, asked about single-subject designs • Before becoming an applied statistician, my academic training included behavior modification • Will and I decided to pursue this through a grant
Current Work • Multilevel models • allow different behavior patterns across subjects • can account for those differences using characteristics of the subjects • Examples use increasingly complex designs • One-phase studies (treatment only) • Two-phase studies (AB) • Four-phase studies (ABAB). 8
Fellow Travelers on the HLM Highway • Marquis, J. G., Horner, R. H., Carr, E. G., Turnbull, A. P., Thompson, M., Behrens, G. A., et al. (2000). A meta-analysis of positive behavior support. In R. Gersten, E. P. Schiller, & S. Vaughn (Eds.), Contemporary special education: Syntheses of the knowledge base on critical instructional issues. Mahwah,NJ: Lawrence Erlbaum Associates. • Van den Noortgate, W., & Onghena, P. (2003). Combining single-case experimental data using hierarchical linear models. School Psychology Quarterly. 18, 325 –346. • Van den Noortgate, W., & Onghena, P. (2003). Hierarchical linear models for the quantitative integration of effect sizes in single-case research. Behavior Research Methods, Instruments, & Computers. 35, 1 – 10.