Download
1 / 7
70 likes | 89 Views
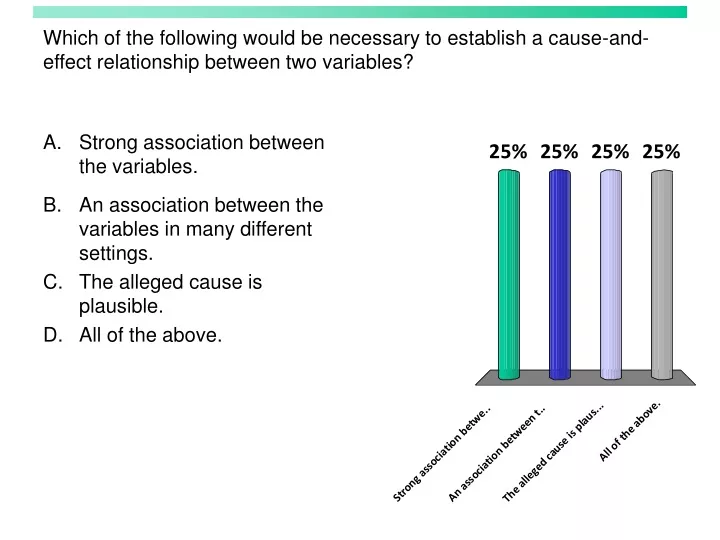
Which of the following would be necessary to establish a cause-and- effect relationship between two variables?. Strong association between the variables. An association between the variables in many different settings. The alleged cause is plausible. All of the above.

E N D
Which of the following would be necessary to establish a cause-and-effect relationship between two variables? Strong association between the variables. An association between the variables in many different settings. The alleged cause is plausible. All of the above.
When possible, what is the best way to establish that an observedassociation is the result of a cause-and-effect relationship? Study the least-squares regression line. Obtain the correlation coefficient. Use a well-designed experiment. Examine z-scores rather than the original variables.
What is one of the main reasons it is difficult to conclude a cause-and-effect relationship? Extrapolation of the data Common responses Lurking variables High values of the coefficient of determination
The regression line to predict average exam grade from hours of study is . The slopeof the regression line indicates. For any student, an extra hour of study is predicted to increase the grade 5.6 points. on average, an extra hour of study is predicted to increase the grade 5.6 points. an extra hour of study will increase the grade 15 points
A store manager conducted an experiment in which he systematically varied the width of a display for toothpaste from 3 ft. to 6 ft. and recorded the corresponding number of tubes of toothpaste sold per day. The data was used to fit a regression line, which was tubes sold per day = 20+10(display width)What is the predicted number of tubes sold per day for a display width of 12 feet? 120 140 Neither
A researcher examines data from all cities with populations over100,000 in the United States. He notices that those cities that havea major league baseball team tend to have a greater number ofdivorces than other cities. One can reasonably conclude that the presence of a major league baseball team contributes to divorce. Men spend time at the ballpark at the expense of their marriage. this correlation cannot be explained and is probably accidental. Cities with major league baseball teams should have no more divorces than other cities. none of the above.
Answers: D, C, C, B, C (12 feet is far away from the data), C (the lurking variable is “population of the city”)