Download
1 / 42
420 likes | 589 Views
Nonparametric maximum likelihood estimation (MLE) for bivariate censored data. Marloes H. Maathuis advisors: Piet Groeneboom and Jon A. Wellner. Motivation. Estimate the distribution function of the incubation period of HIV/AIDS: Nonparametrically Based on censored data:

E N D
Nonparametric maximum likelihood estimation (MLE) for bivariate censored data Marloes H. Maathuis advisors: Piet Groeneboom and Jon A. Wellner
Motivation Estimate the distribution function of the incubation period of HIV/AIDS: • Nonparametrically • Based on censored data: • Time of HIV infection is interval censored • Time of onset of AIDS is interval censored or right censored
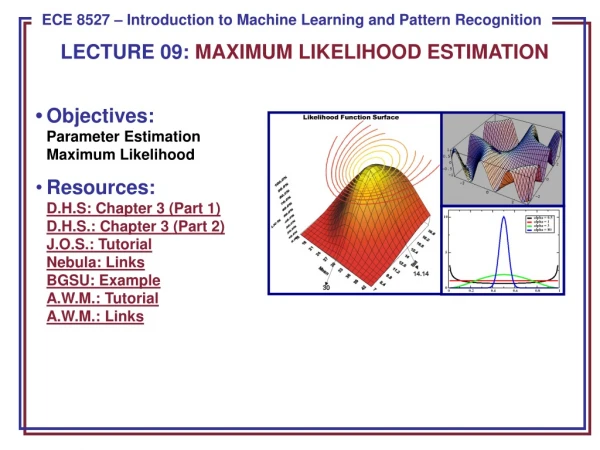
Approach • Use MLE to estimate the bivariate distribution • Integrate over diagonal strips: P(Y-X ≤ z) Y (AIDS) z X (HIV)
Main focus of the project • MLE for bivariate censored data: • Computational aspects • (In)consistency and methods to repair the inconsistency
Main focus of the project • MLE for bivariate censored data: • Computational aspects • (In)consistency and methods to repair the inconsistency
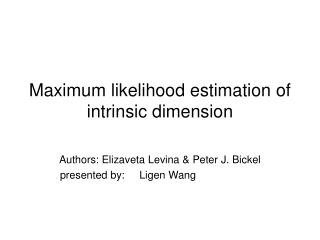
Y (AIDS) 1996 Interval of onset of AIDS 1992 1980 1980 1983 1986 X (HIV) Interval of HIV infection
Observation rectangle Ri Y (AIDS) 1996 Interval of onset of AIDS 1992 1980 1980 1983 1986 X (HIV) Interval of HIV infection
Observation rectangle Ri Y (AIDS) X (HIV)
Observation rectangle Ri Maximal intersections Y (AIDS) X (HIV)
Observation rectangle Ri Maximal intersections Y (AIDS) X (HIV)
Observation rectangle Ri Maximal intersections Y (AIDS) X (HIV)
Observation rectangle Ri Maximal intersections Y (AIDS) X (HIV)
Observation rectangle Ri Maximal intersections Y (AIDS) X (HIV)
Observation rectangle Ri Maximal intersections Y (AIDS) α1 α2 α3 α4 s.t. and X (HIV)
Observation rectangle Ri Maximal intersections Y (AIDS) 2 5 s.t. and X (HIV) 3/5 0 0 The αi’s are not always uniquely determined: mixture non uniqueness
Computation of the MLE • Reduction step: determine the maximal intersections • Optimization step: determine the amounts of mass assigned to the maximal intersections
Computation of the MLE • Reduction step: determine the maximal intersections • Optimization step: determine the amounts of mass assigned to the maximal intersections
Existing reduction algorithms • Betensky and Finkelstein (1999, Stat. in Medicine) • Gentleman and Vandal (2001, JCGS) • Song (2001, Ph.D. thesis) • Bogaerts and Lesaffre (2003, Tech. report) The first three algorithms are very slow, the last algorithm is of complexity O(n3).
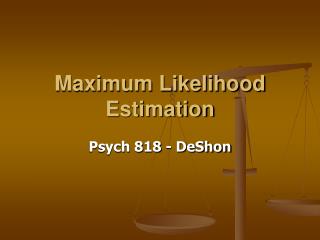
New algorithms • Tree algorithm • Height map algorithm: • based on the idea of a height map of the observation rectangles • very simple • very fast: O(n2)
Height map algorithm: O(n2) 1 1 1 1 1 0 0 0 0 1 2 2 2 1 0 0 0 0 1 2 3 3 2 1 1 1 0 1 2 3 2 3 1 2 1 0 1 2 2 2 1 0 1 0 0 0 1 1 1 0 0 1 0 0 0 1 1 2 1 1 2 1 1 0 0 0 1 1 1 2 1 1 0 0 0 0 0 0 1 0 0
Main focus of the project • MLE of bivariate censored data: • Computational aspects • (In)consistency and methods to repair the inconsistency
u1 u2 Time of HIV infection is interval censored case 2 AIDS HIV
u1 u2 Time of HIV infection is interval censored case 2 AIDS HIV
u1 u2 Time of HIV infection is interval censored case 2 AIDS HIV
t = min(c,y) u1 u2 Time of onset of AIDS is right censored AIDS HIV
u1 u2 Time of onset of AIDS is right censored AIDS t = min(c,y) HIV
u1 u2 Time of onset of AIDS is right censored AIDS t = min(c,y) HIV
t = min(c,y) AIDS u1 u2 HIV
t = min(c,y) AIDS u1 u2 HIV
t = min(c,y) AIDS u1 u2 HIV
t = min(c,y) AIDS u1 u2 HIV
Methods to repair inconsistency • Transform the lines into strips • MLE on a sieve of piecewise constant densities • Kullback-Leibler approach
X = time of HIV infection Y = time of onset of AIDS Z = Y-X = incubation period • cannot be estimated consistently
X = time of HIV infection Y = time of onset of AIDS Z = Y-X = incubation period • An example of a parameter we can estimate consis- tently is:
Conclusions (1) • Our algorithms for the parameter reduction step are significantly faster than other existing algorithms. • We proved that in general the naive MLE is an inconsistent estimator for our AIDS model.
Conclusions (2) • We explored several methods to repair the inconsistency of the naive MLE. • cannot be estimated consistently without additional assumptions. An alternative parameter that we can estimate consistently is: .
Acknowledgements • Piet Groeneboom • Jon Wellner