Download
1 / 17
260 likes | 854 Views
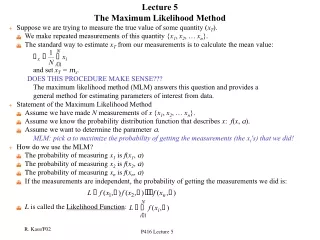
Plausible observations and plausible models. The maximum likelihood method. Likelihood = probability that an observation is predicted by the specified model. MLE.

E N D
Plausible observations and plausible models The maximum likelihood method Likelihood = probability that an observation is predicted by the specified model
MLE • Observations are ‘outcomes of random experiments’: the outcome is represented by a random variable (e.g. Y). A representation of Y is yi (I = 1, 2, …. m) • The distribution of possible outcomes is given by probability distribution. • The same data (observations) can be generated by different models and the different observations may be generated by the same model. what is the range of plausible observations, given the model, and what are the different models that could plausibly have generated the data? • Plausible observations and plausible models • A probability model predicts an outcome and associates a probability with each outcome.
What is a plausible model? A model that predicts observations with a probability that exceeds a given minimum. What is the most plausible model? A model that most likely predicts observations, i.e. that predicts the observations with the largest probability most likely model, given the data.
Observation from a normal distribution N(,2) Probability that an observation is predicted by N(,2): probability that 120 is predicted by N(100,100): Probability that 120 is predicted by N(120,100):
Log-likelihood 0.3989
Range of plausible modelsLikelihood ratio Ratio of likelihood of any model to likelihood of ‘best’ model Log-likelihood ratio ln = - ½ z2 z2 = -2ln With the specified model and the ‘best’model
A plausible value of is one for which the likelihood ratio exceeds a critical value (less negative), e.g. -1.9208, which corresponds to a 95% confidence interval, or -1.353 which corresponds to a 90% confidence interval. Values of for which ln > -1.9208 is the support range for . When is outside the support range, we reject the claim that does not differ significantly from b . We accept a risk of 5% of wrongly rejecting the claim (Type I error).
To get support range, find * for which ln = -1.9208 (given that ‘best’ value of is 125 and 2 is fixed): Solution: The observation could come from ANY model in the support range. All models in the ‘support range’ are supported by the data.
Observation from a binomial distribution with parameter p and index m Likelihood function: Log-likelihood function:
Analysis of young adults who left home leave out censored cases (conditional analysis) 20 obervations