Download
1 / 30
310 likes | 561 Views
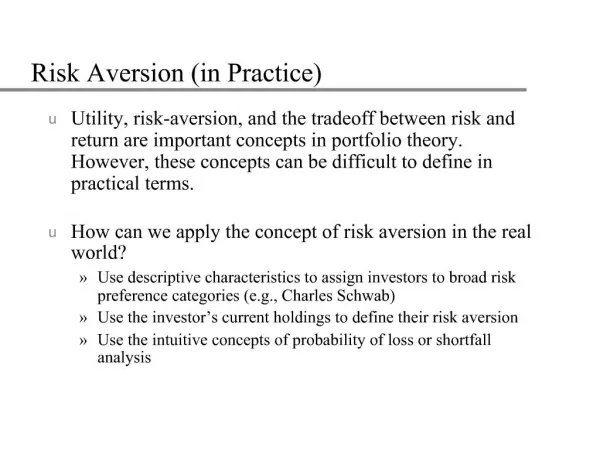
Dottorato in Infrastrutture e Trasporti XXII Ciclo Curriculum Ingegneria dei Trasporti III Anno. A test of loss aversion in route choice. Ing. Selenia Perelli. Objectives of Research. Car user behaviour reaction analysis to urban Road Pricing (RP) policies

E N D
Dottorato in Infrastrutture e TrasportiXXII CicloCurriculum Ingegneria dei TrasportiIII Anno A test of loss aversion in route choice Ing. Selenia Perelli
Objectives of Research Car user behaviour reaction analysis to urban Road Pricing (RP) policies • Theoretical and empirical analysis of RP systems • Empirical analysis of behaviour reactions according to different demand segments • Analysis of the asymmetries in user preferences and application to transport demand 2
Asymmetry and loss aversion Is the idea that individuals have an asymmetry of value: the disutility of giving up an object is greater than the utility associated with acquiring it Loss aversion explains effects which have been observed in experiments: endowment effect: individuals demand much more to give up an object than they would be willing to pay to acquire it (WTA>WTP) preference reversal in reference-dependent choices 3
Reference dependence Example: options evaluated from different reference points
Choices change with reference Commute time quality A’ B P(B/A’) = 70 % P(B/A’’) = 33% C A’’ Social contact quality
New theory of choice Observed choices are best explained if one assumes: carriers of utility are not states but changes (gains and losses) relative to a reference point losses are valued more heavily than gains 6
Literature • Experimental studies: • Review: Kahneman, Knetsch and Thaler (1991) • Theory and modelling: • Riskless choice modelling: Tversky and Kahneman (1991) • Logit with asymmetries: • Suzuki, Tyworth and Novack (2001) • Hess, Rose and Hensher (2008) • Valuation measures: • Bateman, Munro, Rhodes, Starmer and Sugden (1997) • De Borger and Fosgerau (2008)
Third year research To test the hypothesis of loss aversion in route choices: formulation of a logit model with asymmetries model calibration and statistical tests measurement of the values of time comparisons with results of standard logit 8
Model hypotheses • Hp1: Carriers of utilities are gains and losses • Hp2: Reference dependence: gains and losses are evaluated with respect to current choice state • Hp3: Loss aversion: gains and losses receive a different evaluation and losses > gains • Hp4: Choices depend on Time and Money
( ) ( ) R 0 = b × - + b × - V T T M M 1 T 0 1 M 1 0 ( ) ( ) R 0 = b × - + b × - V T T M M 2 T 0 2 M 2 0 T time Mout-of-pocket cost coefficient Basic model: reference-dependence without loss aversion A0 reference alternative A1first alternative A2 second alternative
Systematic utility functions: single-attribute part GAINS LOSSES
Choice probability T0 - Ti loss reference point gain
Model calibration: what is expected statistically significant (t test) gains losses significantly different from significantly different from asymmetry loss aversion
Survey Stated Preferences about a new urban infrastructure in the city of Rome Route choice in relation to time and money 356 interviews: three choices with variable money (1, 2, 4 €) for each interview (totalling 1068 observations) Three questions (Q1, Q2 and Q3): each interviewee answered only one question 15
D D > > t, p t, p 0 0 Question 1 and utilities Q1: willingness to pay in return for time saving? A revealed 0 A revealed 1 A “ sottopasso ” with toll 2 Basic model Asymmetric model = = V 0 V 0 1 1 = b × D + b × = b × D + b × V t p V t p 2 2 GT LM T M
= - b × D = b × D V t V t 1 1 LT T = b × = b × V p V p 2 2 LM M D D > > t, p t, p 0 0 Question 2 and utilities Q2: in an initial period you save time without paying; willingness to pay to keep the time saving and not losing it? A sottopasso without toll 0 A revealed 1 A “ sottopasso ” with toll 2 Basic model Asymmetric model
= = 0 V V 0 1 1 = b × D + b × = - b × D - b × V t p V t p 2 2 LT GM T M D D > > t, p t, p 0 0 Question 3 and utilities Q3: willingness to accept money in return for delays? A revealed 0 A revealed 1 A revealed with time increase and negative toll 2 Basic model Asymmetric model
Model calibration: results Basic model Asymmetric model RsqAdj = 0.4256 RsqAdj = 0.4394
b b = > b b LT LT GT GT b b = > b b LM LM GM GM Test on loss aversion • Null hypothesis (H0): , • Two-tailed test • Time: -1.53 > -1.65 (10%) Accept H0 • Money: -3.30 < -1.96 (5%) Reject H0 • One-tailed test ( , ) • Time: -1.53 < -1.28 (10%) Reject H0 • Money: -3.30 < -1.65 (5%) Reject H0
Test on model specification • Null hypothesis: the basic model is the correct specification • The probability that, if the null hypothesis is true, the difference between RsqAdj (=0.01383) would be exceeded is less then 10-3
time gain toll gain toll loss time loss Value of Time (VOT) WTP willingness to pay EGequivalent gain ELequivalent loss WTA willingness to accept
( ) ( ) - D + = , , V T t M p V T M 0 0 0 0 b × D + b × = 0 t p GT LM b × D + b × = 0 t p b T M = = - GT 1 VOT WTP b b = = - T VOT WTP LM b M VOT1: WTP WTP a toll in return for a time gain 0 Δt,p > Basic model Asymmetric model
b × = - b × D p t M T b = = - T VOT EL b M VOT2: EL WTP a toll in place of a time loss ( ) ( ) + = + D , , V T M p V T t M 0 0 0 0 , t p D > 0 Basic model Asymmetric model b × = b × D p t LM LT b = = + LT 2 VOT EL b LM
- b × D - b × = b t p 0 T M = = - T VOT WTA b M VOT3: WTA WT A a toll in return for a time loss ( ) ( ) + D - = , , V T t M p V T M 0 0 0 0 D t p > , 0 Basic model Asymmetric model b × D + b × = 0 t p LT GM b = = - LT 3 VOT WTA b GM
VOT = WTP = EL = WTA b = - T WTP < EL < WTA VOT1 < VOT2 < VOT3 VOT b M b b b - < < - GT LT LT b b b LM LM GM VOT & Models Basic model Asymmetric model
VOT: results Basic model Asymmetric model
Conclusions • Asymmetric response to gains and losses in attributes has been incorporated in a logit model • The empirical analysis confirms that loss aversion effects are statistically significant • The logit with asymmetries relative to a reference point outperforms conventional logit • The different valuation measures of time (WTP, WTA, EL) conform to theoretical expectations • Further research: implications of the use of asymmetric demand for network models 29
Thanks for your attentionSpecial thanks to Prof. Francesco Filippi and Ing. Paolo Delle Site 30