Download
1 / 25
250 likes | 337 Views
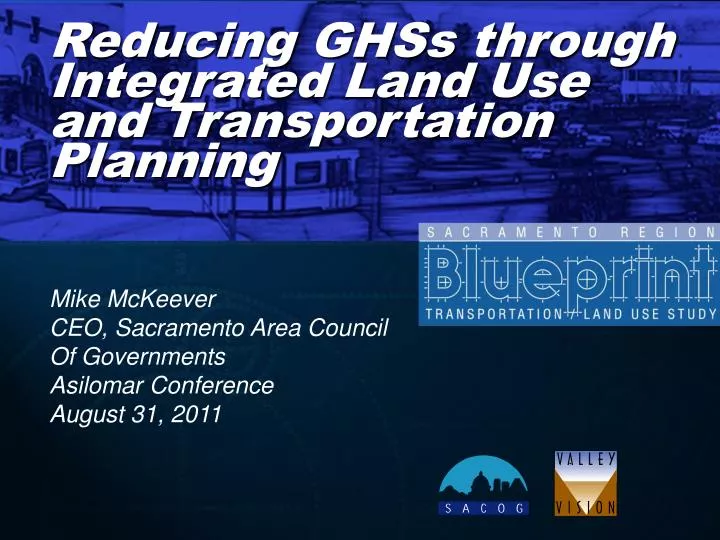
Reducing GHSs through Integrated Land Use and Transportation Planning. Mike McKeever CEO, Sacramento Area Council Of Governments Asilomar Conference August 31, 2011. Sacramento Area Council of Governments (SACOG). 6 counties 22 cities 2.2 million people 31 Board members.

E N D
Reducing GHSs through Integrated Land Use and Transportation Planning Mike McKeever CEO, Sacramento Area Council Of Governments Asilomar Conference August 31, 2011
Sacramento Area Council of Governments (SACOG) 6 counties 22 cities 2.2 million people 31 Board members
Growth in Households2002 to 2050 Data from Center for the Continuing Study of the California Economy 55 and Over With Children
Housing PreferencesOf Households 55 and Over Who Say They Will Move in 1 to 5+ Years Metro Chamber Housing Survey 2003
Housing Choice New Housing Stock (in percent)
Introduction to four community types • Region made up of different communities • Community types are in all of the cities and counties in the region
1-4. Growth in all communities New Homes In thousands
17. Share of new homes near high-frequency transit In thousands
17. Share of new homes near high-frequency transit In thousands
17. Share of new homes near high-frequency transit In thousands
18. Share of new jobs near high-frequency transit In thousands
18. Share of new jobs near high-frequency transit In thousands
18. Share of new jobs near high-frequency transit In thousands
Community Types: Total Cost of Transportation per household • Auto ownership • Auto use • Transit
19. Transit costs recovered by ticket sales • Budget share for transit increased some, but
19. Transit costs recovered by ticket sales • Some increasing budget share to transit, but • Much bigger increase in vehicle service hours, because • Focusing more on higher frequency service than expanded geographic coverage, and
19. Transit costs recovered by ticket sales • Some increasing budget share to transit, but • Much bigger increase in vehicle service hours, because
19. Transit costs recovered by ticket sales • Result is more productive investment: • Big increase in transit boardings and • Big increase in total percent of cost covered by ticket revenues
25. Weekday passenger CO2 emissions (SB 375 target) SACOG’s target from California Air Resources Board = -16%