Download
1 / 48
500 likes | 926 Views
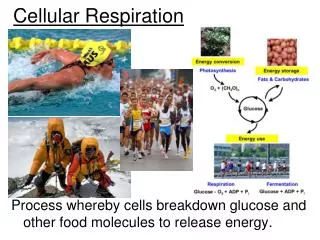
Cellular Respiration. Chapter 8. Figure 9.1 Energy flow and chemical recycling in ecosystems. Figure 9.5 An introduction to electron transport chains. Cellular Respiration. A cellular process that requires oxygen and gives off carbon dioxide.

E N D
Cellular Respiration Chapter 8 Mader: Biology 8th Ed.
Figure 9.1 Energy flow and chemical recycling in ecosystems Mader: Biology 8th Ed.
Figure 9.5 An introduction to electron transport chains Mader: Biology 8th Ed.
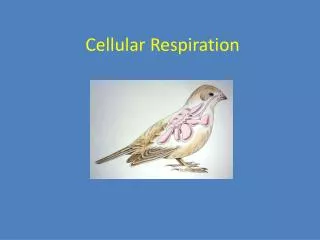
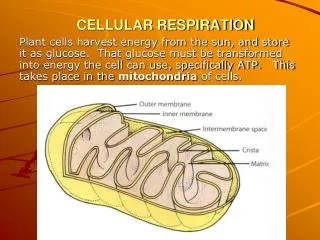
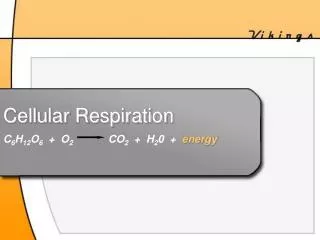
Cellular Respiration • A cellular process that requires oxygen and gives off carbon dioxide. • Most often involves complete breakdown of glucose to carbon dioxide and water. • Energy within a glucose molecule is released slowly so that ATP can be produced gradually. • NAD+ and FAD are oxidation-reduction enzymes active during cellular respiration. Mader: Biology 8th Ed.
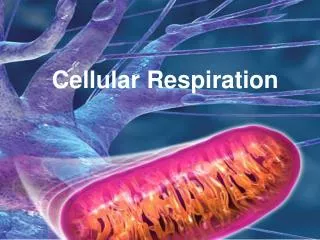
Mitochondrion Structure and Function Mader: Biology 8th Ed.
Figure 9.x1 ATP Mader: Biology 8th Ed.
Figure 9.2 A review of how ATP drives cellular work Mader: Biology 8th Ed.
Figure 9.4 NAD+ as an electron shuttle Mader: Biology 8th Ed.
Glucose Breakdown • During glycolysis, glucose is broken down in cytoplasm to two molecules of pyruvate. • During transition reaction, pyruvate is oxidized, NADH is formed, and waste carbon dioxide is removed. • Citric acid cycle results in NADH and FADH2, release of carbon dioxide, and production of additional ATP. • Electron transport chain produces 32 or 34 molecules of ATP. Mader: Biology 8th Ed.
Glucose Breakdown Mader: Biology 8th Ed.
Glycolysis • Two ATP are used to activate glucose that splits into PGAL. • Oxidation of PGAL and subsequent substrates results in four high-energy phosphate groups, which synthesize four ATP. • Called Substrate-Level Phosphorylation Mader: Biology 8th Ed.
Figure 9.7 Substrate-level phosphorylation Mader: Biology 8th Ed.
Glycolysis Mader: Biology 8th Ed.
Figure 9.9 A closer look at glycolysis: energy investment phase (Layer 1) Mader: Biology 8th Ed.
Figure 9.9 A closer look at glycolysis: energy investment phase (Layer 2) Mader: Biology 8th Ed.
Figure 9.9 A closer look at glycolysis: energy payoff phase (Layer 3) Mader: Biology 8th Ed.
Figure 9.9 A closer look at glycolysis: energy payoff phase (Layer 4) Mader: Biology 8th Ed.
Figure 9.8 The energy input and output of glycolysis Mader: Biology 8th Ed.
Inside the Mitochondria • End product of glycolysis, pyruvate, enters the mitochondria, where it is oxidized to carbon dioxide during the transition reaction and citric acid cycle. • CO2 and ATP are transported out of mitochondria into the cytoplasm. Mader: Biology 8th Ed.
Figure 7.17 The mitochondrion, site of cellular respiration Mader: Biology 8th Ed.
Transition Reaction • Connects glycolysis to the citric acid cycle. Mader: Biology 8th Ed.
Figure 9.10 Conversion of pyruvate to acetyl CoA, the junction between glycolysis and the Krebs cycle Mader: Biology 8th Ed.
Citric Acid Cycle • Originally called Krebs cycle. Mader: Biology 8th Ed.
Figure 9.11 A closer look at the Krebs cycle (Layer 1) Mader: Biology 8th Ed.
Figure 9.11 A closer look at the Krebs cycle (Layer 2) Mader: Biology 8th Ed.
Figure 9.11 A closer look at the Krebs cycle (Layer 4) Mader: Biology 8th Ed.
Figure 9.11 A closer look at the Krebs cycle (Layer 3) Mader: Biology 8th Ed.
Figure 9.12 A summary of the Krebs cycle Mader: Biology 8th Ed.
Electron Transport System • As electrons pass down the electron transport system, energy is captured and ATP is produced. • Oxidative phosphorylation refers to the production of ATP as a result of energy released by the electron transport system. • The total of 32-34 ATP produced by ETS is calculated by allowing 3 ATP per NADH and 2 ATP per FADH2 that enter the ETS. Mader: Biology 8th Ed.
Figure 9.13 Free-energy change during electron transport Mader: Biology 8th Ed.
Figure 9.14 ATP synthase, a molecular mill Mader: Biology 8th Ed.
Figure 9.15 Chemiosmosis couples the electron transport chain to ATP synthesis Mader: Biology 8th Ed.
Figure 9.x2 Fermentation Mader: Biology 8th Ed.
Fermentation • Glycolysis followed by reduction of pyruvate by NADH to either lactate or alcohol and carbon dioxide. • Anaerobic pathway. • Can provide rapid burst of ATP. • Lactic Acid Fermentation is common in muscle cells. Mader: Biology 8th Ed.
Fermentation Mader: Biology 8th Ed.
Fermentation Alcohol--yeast produce wine and beer and cause bread to rise. pyruvate + NADH + H+ C2H5OH (ethyl alcohol) + carbon dioxide + NAD+ Lactic Acid—bacteria produce yogurt, sauerkraut, cheese. Also in muscle cells when working anaerobically. pyruvate + NADH + H+ lactic acid + NAD+ Mader: Biology 8th Ed.
Figure 9.18 Pyruvate as a key juncture in catabolism Mader: Biology 8th Ed.
Comparison of the Efficiency of Cellular Respiration versus Fermentation • One mole of glucose yields 686 kcal in a colorimeter. • Cellular respiration has a yield of about 263 kcal. • 1 ATP = 7.3 kcal; therefore 7.3 kcal X 36 = 263 kcal • 263/686 = 38% of available energy is used. What happened to the rest? • Fermentation yields only 2 ATP or about 15/686 or 2% of available energy. Mader: Biology 8th Ed.
Metabolic Pool • Carbohydrates, fats, and proteins can be used as energy sources. • Catabolism produces molecules that can also be used for anabolism and other compounds. • All reactions in cellular respiration are part of a metabolic pool, and their substrates can be used for catabolism or anabolism. Mader: Biology 8th Ed.
Figure 9.19 The catabolism of various food molecules Mader: Biology 8th Ed.
Control of Cellular Respiration • The important switch in the control of respiration is the enzyme phosphofructokinase. • This enzyme catalyzes step 3 of glycolysis. • Phosphofructokinase is inhibited by ATP and stimulated by ADP or AMP. • It is also inhibited by citric acid. This synchronizes the rates of glycolysis and the Krebs Cycle. Mader: Biology 8th Ed.
Figure 9.20 The control of cellular respiration Mader: Biology 8th Ed.
Figure 9.6 An overview of cellular respiration (Layer 1) Mader: Biology 8th Ed.
Figure 9.6 An overview of cellular respiration (Layer 2) Mader: Biology 8th Ed.
Figure 9.6 An overview of cellular respiration (Layer 3) Mader: Biology 8th Ed.
Figure 9.16 Review: how each molecule of glucose yields many ATP molecules during cellular respiration Mader: Biology 8th Ed.