Download
1 / 66
660 likes | 665 Views
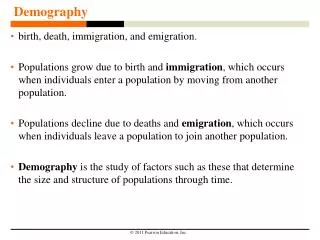
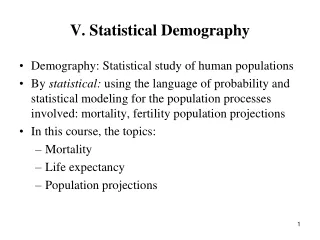
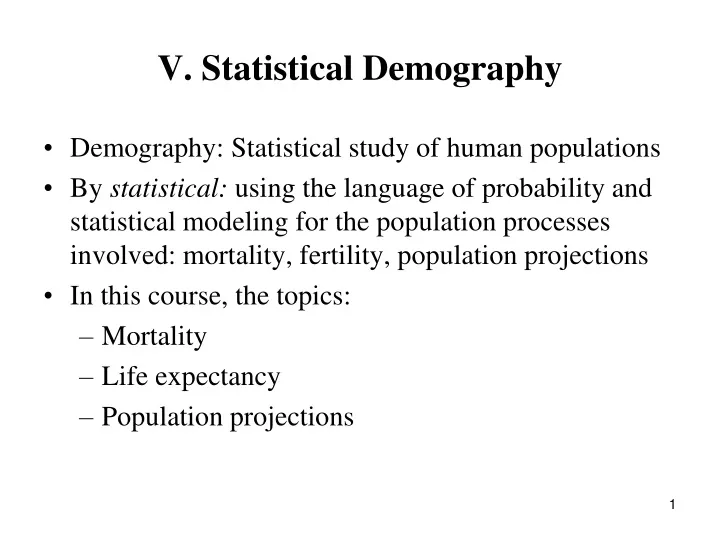
V. Statistical Demography. Demography: Statistical study of human populations By statistical: using the language of probability and statistical modeling for the population processes involved: mortality, fertility, population projections In this course, the topics: Mortality Life expectancy

E N D
V. Statistical Demography • Demography: Statistical study of human populations • By statistical: using the language of probability and statistical modeling for the population processes involved: mortality, fertility, population projections • In this course, the topics: • Mortality • Life expectancy • Population projections
Mortality topics • Crude Death Rate • Annual number of deaths per 1000 • Standardized crude death rate • Age- and gender specific death rates • Probability of death • Mortality table, life table (dødelighetstabell) • Modeling mortality rates (population projections)
D = number of deaths during one given year P0 = population size at January 1 P1 = population size at December 31 A measure of mortality: Annual number of deaths pr. 1000 Crude death rate, CDR Mortality in the whole population regardless of age CDR can be misleading with comparisons in time and space, because it does not take into account the age structure in the population
Standardize CDR forage and gender • Example: • Norway 1950: CDR = 9,13 • Norway 1987: CDR = 11,14 • CDR has increased by 2 per 1000, but has really the mortality increased? • Age specific death rates in 1987 < 1950 for all ages • Explanation: Population is older in 1987!
Age specific death rate or mortality rate: Dx = number of deaths for agegroup x P0,x and P1,x : Size of population for agegroup x at the start- and end-population for age x
Standardized (hypothetical) CDR • CDR in a hypothetical population with 1950 age structure and 1987 age specific death rates • Alternatively: CDR in a hypothetical population with 1987 age structure and 1950 age specific death rates
Population 1987 with 1950 death rates: The hypothetical number of deaths in the age group x: Standardized CDR:
Population 1950 with 1987 death rates: The hypothetical number of deaths in the age group x: Standardized CDR:
Norway 1950 and 1987 standardized CDR N: mean population size in 1000 D: number of deaths, d = D/N per10 000, s.d. = CDR
Comparison of observed and standardized mortality rates • Compare the four crude deaths rates (two unstandardized and two standarized) • How much of the difference between the CDR in 1950 and 1987 is due to: • Age strucuture • Mortality • The change in CDR of 2 per 1000 is the sum of these two components
Standardized CDR 1: CDR (Pop87&mortality50) – CDR(50): due to effect of age structure = 4,64 2: CDR (87) – CDR (Pop87&mortality 50): due to change in age specific mortality rates = - 2,63
Effect of changing factors • CDR increased by 2 from 1950 to 1987, but with constant age specific mortality it would have increased by 4,64 • Effect of an aging population • The reduced age specific mortality has reduced the increase in CDR to only 2: 2,6 reduced increase • Effect of lower age specific mortality
Alternative computation 1: CDR (Pop50&mortality87) – CDR(50): due to change in age specific mortality rates = -1,94 2: CDR (87) – CDR (Pop50&mortality 87): due to effect of age structure = 3,95
Some comments • Standardized rates will vary with the standard use and so will the quantitative conclusion • Can also control for gender • When comparing two countries: A third country age structure can be used as standard • Example:Mauritius vs England and Wales with Japan age structure as standard
1. All age-specific death rates are higher in Mauritius for both men and women 2. Yet, unstandardized CDR is 6.7 compared to 11.3 for England and Wales 3. Reason: Population in Mauritius is much younger 4. The standardized CDRs are 12.20 for Mauritius and 7.97 for England and Wales, according to the age structure in Japan
Direct standardization • Same age structures • Different age specific mortality rates • Here we ”control” for age, as in the previous example • Another example: • CDR for Kuwait in 1996: 2.18 per 1000 • CDR for United Kingdom (England, Wales, Scotland and Northern Ireland): 10.0 per 1000 • If we use UK 1996 age structure as standard: Kuwaits CDR is 12.75 per 1000
Indirect standardization • The most common approach in studies of mortality • A standard of age specific death rates, combined with age structure ( f.ex. from censuses) • Compute expected number of deaths based on actual age structure and standard age specific death rates • Compute standardized mortality ratio (SMR) = observednumber of deaths/ expected number of deaths SMR > 1: actual (but unknown) age specific death rates are higher than the standard SMR < 1: actual (but unknown) age specific death rates are lower than the standard
Example UK vs. Kuwait • UK 1996 CDR = 10.0, Kuwait 1996 CDR = 2.2 • Standard age specific death rates: UK 1996 • Compute expected number of deaths for Kuwait, based on Kuwaits age structure and standard death rates • Result: 3459 • Observed number of deaths: 3815 • Standardized mortality ratio SMR = 3815/3459 = 1.10 • SMR >1: Age specific mortality in Kuwait must be higher than the standard UK
Probability of death P0,x: number of persons alive at exact age x Dx = number of deaths for this agegroup x and P1,x:population size for agegroup x at the end for age x q(x) = estimated probability of dying before the age of x+1 given that the person is alive at age x, the oneyear death probability If we observe Dx :
Let Dx,totalbe the total number of deaths for this agegroup If only aggregated numbers are available: q(x) is the ratio of Dx,totalto the ”middle” population half-way: Age specific mortality rate
Example Individual data: q(60) can be calculated directly Aggregated data, knows only P0, P1 and the total number of deaths during one year of this age group: first mortality rate m(x) and then q(x)
If m(x) = 0 then q(x) = 0, While if all die, m(x) = 2 and q(x) = 1 When all die: Dx = P0,x and P1,x = 0 and m(x) = P0,x /(P0,x/2) = 2. Then: q(x) = 2/(1+2/2) =1. Otherwise: q(x)< m(x)
Mortality table (life table) • First time: John Graunt in 1662 • A method for summarizing age dependent death rates/probabilities for a given year • A hypothetical cohort (for example 100 000 persons) experience deaths in accordance with the mortality rates: simulate the lifecareer to a table population (life table population) • Can answer several questions using a standard mortality table: • How many are alive after 1, 2, 3, …years? • What is the life expectancy ( forventet levealder)? • What are the chance of dying between two given ages?
Life expectancy • The number of years a person born today can be expected to live under the current age specific mortality rates. • Specifically: Given age specific death rates (or death probabilities) for ages 0, 1, 2, 3, … • Remaining life expectancy for a certain age x, under the current age specific death rates (death probabilities) for ages x, x +1, x + 2, … • Notation: ex for x = 0, 1, 2, … • Hence: e0 is life expectancy at birth
NB! • Life expectancy and remaining life expectancy is a hypothetical ( also called synthetical : kunstig) measure of mortality. • Example: In 2012 in Norway, for male of age 64: • e64 = 19.03 years. So 64 year old Norwegian men can expect to be 83.03 years old • But mortality will decrease in the coming years so the true expected age will be higher than 83.03 • There is a difference between remaining life years based on synthetic mortality and cohort data ( real age)
Now, Hence,
Assume p(x) is specified for the ages x = 0, 1, 2, .. Approximation, assuming linearity of p(t) in each interval [x,x+1): This is the trapezoidal method of numerical integration
The trapezoidal method of numerical integration The function (in blue) is approximated by a linear function (in red) The area under the curve f(x) is approximated by a trapezoid (only two parallell lines), norsk: trapes
Estimation of p(x + t) = P(X > x + t), the probability of survival at age x +t. q(x) is the estimated probability of death at age x, i.e., the probability of death between the ages of x and x +1 so the probablity of death before age x +t is the sum of q(k) for k = 0,…, x+t-1. Hence an estimate of the probability of survival at age x + t is given by: Based on theseestimates, we can compute the number of persons alive at age x+t based on a hypothetical (synthetic) population of 100 000.
For example, assume q(0) = 2.73 and q(1) = 0.25 per 1000. Then an estimate of P(X>2) = 1- (q(0) + q(1))= 0.99702 Then the number of persons remaining alive at age 2 will be 100 000 . 0.99702 = 99702. Let Ix+tbe the number of survivals at age x + t in the synthetic population of 100 000. Then It follows that
Estimated life expectancy This is obtained from a life table or mortality table
60,6% chance of reaching 83 40% chance of reaching 88 For a 90 year old, the chance of reaching the age of 100 = 2089/31274 = 6.7%.
Construction of life table • Compute the age specific mortality rates m(x) • Compute q(x) = m(x)/[1+m(x)/2] • Derive the estimated p(x + t) • Derive Ix in the synthetic population of 100 000 • Start with I0 = 100 000 • Compute the number of deaths dx at the same time as Ix • Finally compute estimated ex
Historic development of life expectancy at birth,estimated e0 Women Men Increase in life expectancy every decade for Norway
Record life expectancy: has increased approximately linearly the last 160 years (2,5 year each decade)
Population projections: forecast life expectancy • Need to predict mortality rates in the future. Shall describe a method suggested by Lee-Carter (1992), the most used approach • To model and forecast mortality: Standard methods for forecasting time series, together with a simple model for the age-time surface of the log of mortality. A forecast is produced for the probability distribution of each future age specific death rate • We have data of mortality rates for the years t = T0,…,T1
Lee-Carter model Hence, ea(x) is the geometric mean of m(x,t) over t a(x):age-specific constants describing the general pattern of mortality for the whole base period b(x)k(t) is an age(row) by time (column) matrix and the columns are proportional Hence, the model will fit the data well, if the columns of {log m(x,t)-a(x) } are close to proportional
k(t): index of the level of mortality capturing the main trend in death rates b(x): age-specific constants describing the relative speed of change in mortality at each age The model is undetermined, because if b(.) and k(.) are one solution, then so are b(.)c and k(.)/c for any constant c.