Download
1 / 11
110 likes | 210 Views
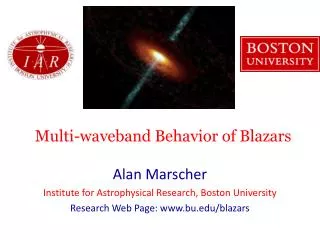
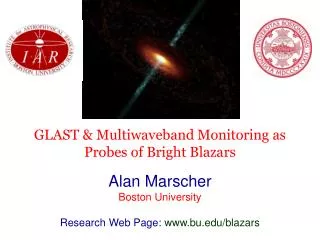
Multiwaveband Opportunities to Study AGN (Mostly Blazars) Detected by Fermi. Alan Marscher Boston University, Incoming Chair of Fermi Users Group Research Web Page: www.bu.edu/blazars. Sketch of Physical Structure of Jet, AGN Based on Current Observations & Theory.

E N D
Multiwaveband Opportunities to Study AGN (Mostly Blazars) Detected by Fermi Alan Marscher Boston University, Incoming Chair of Fermi Users Group Research Web Page:www.bu.edu/blazars
Sketch of Physical Structure of Jet, AGNBased on Current Observations & Theory Basic Goals: 1. Determine where & how gamma-ray emission originates 2. Probe physics of compact jets
Sequences of VLBA Images of Jets of -ray Blazars • Superluminal motion as high as almost 50c • BulkLorentz factor up to 50 Doppler factor can approach 100 3C 279: apparent speeds range from ~ 5c to >20c
Publicly Available Datasets Fermi LAT-monitored source list: Fluxes vs. time at 2 energy bands from automatically processed data, posted on Fermi website SMARTS: www.astro.yale.edu/smarts/ glast/targets.html MOJAVE 15 GHz VLBA monitoring: 200 AGN, mostly blazars, total intensity images at www.physics.purdue.edu/MOJAVE/ BU 43 GHz VLBA monitoring: Total and polarized intensity images: 29 blazars at www.bu.edu Swift partial X-ray light curves of gamma-ray sources http://swift.gsfc.nasa.gov/docs/swift/results/transients/index.html
Nature of Blazar -ray Variability Seen by Fermi In high fraction of bright blazars, -rays occur in sharp flares that rise from the noise ToO’s tend to miss early stage of events, steady monitoring needs to sample densely 0235+164 1510-089 Fermi light curves (weekly averages) 3C 279 0716+714
Possibilities for accessing ground-based telescopes via the Fermi peer review NRAO (radio): VLBA (imaging with resolution as high as 0.15 milliarcsec) EVLA (imaging with resolution of arcseconds or sub-arcseconds) GBT (single antenna, high sensitivity, spectra, timing) NOAO (optical, near-IR, mid-IR): all telescopes, including 8 m Gemini North & South, 4 m-class telescopes, & smaller telescopes in US & Chile
Early Observational Results: PKS 1510-089 107 Multiwaveband monitoring: densely sampled light curves from radio to -ray for correlation analysis Multi-epoch VLBA observations: times of superluminal ejections & flux + polarization history of core & knots Cross-correlate light curves at different connections & time lags ID features on VLBI images responsible for higher-frequency outbursts Black: smoothed Knot ejected
The Quasar 3C 279: Results from Fermi & RXTE • Short X-ray flare at 2008.64 not apparent in gamma-ray data Coincident X-ray & gamma-ray flare at 2008.9 • Gamma-ray flare peaks ~ same time as X-ray flare; latter decays more slowly • Consistent with higher average scattering electron energies for gamma rays than for X-rays Gamma-ray & X-ray data points: Red: actual measurements Black: median smoothed (3 days) (Too early to determine whether flare is associated with a new superluminal knot)
The BL Lac Object AO 0235+164 The BL Lac Object AO 0235+164 • Pair of -ray & optical outbursts; optical higher amplitude • Superluminal knot ejected at time of 1st outburst • Possible 2nd knot ejected at time of 2nd outburst
The Quasar 3C 454.3: Fermi & Optical Monitoring The Quasar 3C 454.3: Ferm & i/Optical Monitoring • Dip in flux essentially simultaneous at -ray, optical, & near-IR frequencies • Maxima at R band lag gamma-ray by 4 days • - Higher amplitude in -ray • VLBA images show core brightening & getting larger but only weak knots emerge (severe inverse Compton energy losses?) • Bonning et al. (2009, arXiv preprint): X-ray flux ~ constant during dip Sept. 4, 2008
Conclusions • Gamma-ray flares & dips coincide with similar lower-frequency events; often some wavebands don’t participate • Some events are frequency-stratified, others are not • Flares are related to superluminal knots in VLBA images • High-E photon emission in the jet occurs in multiple zones • Clear interpretations require comprehensive programs multiple wavebands, minimal gaps in time coverage, VLBA imaging, polarization) • Can take advantage of publicly available datasets