Download
1 / 12
120 likes | 232 Views
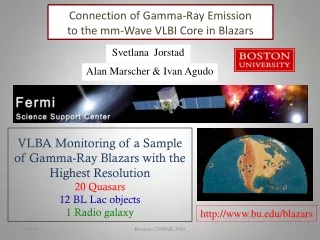
Connection of Gamma-Ray Emission to the mm-Wave VLBI Core in Blazars. Svetlana Jorstad. Alan Marscher & Ivan Agudo. VLBA Monitoring of a Sample of Gamma-Ray Blazars with the Highest Resolution 20 Quasars 12 BL Lac objects 1 Radio galaxy. http://www.bu.edu/blazars.

E N D
Connection of Gamma-Ray Emission to the mm-Wave VLBI Core in Blazars Svetlana Jorstad Alan Marscher & Ivan Agudo VLBA Monitoring of a Sample of Gamma-Ray Blazars with the Highest Resolution 20 Quasars 12 BL Lac objects 1 Radio galaxy http://www.bu.edu/blazars Bremen COSPAR 2010
Kinematics of Parsec Scale Jets • “Core” - bright stationary feature located at one end of the jet on VLBI image. • Moving “component” – knot of enhanced brightness showing a proper motion with respect to the core along the jet direction. Core Knot Bremen COSPAR 2010
Gamma-Ray and 43 GHz Core Light Curves Bremen COSPAR 2010
Gamma-Ray and 43 GHz Core Variability Indices 2. Gamma-Ray Variability Index in the case of detection (Sγmax -max)-2SγminVg=____________________________ (Sγmax +max)+2Sγmin Sγmax max – maximum detected γ-ray flux at 0.1-200 GeV Sγmin - minimum upper limit for γ-ray flux observed 1. Core Variability Index (SRmax -max)-(SRmin +min ) Vr=____________________________ (Srmax +max)+(SRmin +min ) SRmax max - maximum observed flux in the 43GHz core SRmin min - minimum observed flux in the 43 GHz core Aller et al. 2003 3. Gamma-Ray Variability Index in the case of non-detection Sγmax-SγminVg=___________________ Sγmax+Sγmin Sγmax– maximum upper limit of γ-ray flux at 0.1-200 GeV Sγmin - minimum upper limit of γ-ray flux observed Bremen COSPAR 2010
Dependence between Vr and Vg • A good correlation between • Vg and Vr for the quasars and BL Lac objects. • 2. All quasars undetected by the LAT on a weekly basis have low variability index in mm-wave core, Vr ≤ 0.6 γ-ray detection of quasars strongly depends on variability of mm-wave core. • 3. The BL Lac objects show weaker dependence of γ-ray emission on activity in mm-wave core. • 4. Items 2 & 3 imply a possible additional source of γ-rays in BL Lacs with respect to quasars, which is supported by flatter γ-ray spectrum of BL Lacs (Abdo et al. 2010). Bremen COSPAR 2010
Kendall Cross-Correlation Analysis • 1. The method is applicable for upper and lower limits along with detections. • 3. Estimate of 43 GHz core flux for each γ-ray measurement obtained from spline fit to 43 GHz light curve. • 4. τ cross-correlation function derived within +/-140 day delay. • 5. Higher Vr higher τmax (especially for the quasars). τmax is significant at 3σ level for two BL Lac object (0235+164 & 0716+714) and 7 quasars • (0528+134, 1222+216, 3C 273, 1510-089, 1633+382, 3C 345 and 3C 454.3) Bremen COSPAR 2010
Flaring Blazars in the Gamma-Ray Sky -126<ΔT<+14 days Bremen COSPAR 2010
Kinematics of Parsec Scale Jet of 0235+164 and 1510-089 Bremen COSPAR 2010
Kinematics of Parsec Scale Jet of 3C 273 Bremen COSPAR 2010
Where do γ-ray Flares Originate in Blazars? Trend from Small Statistics: 1. Correlation analysis between light curves suggests that γ-ray flares peak before maximum flux in the mm-wave core with delay in 0-30 day range. 2. Timing of superluminal motion: time of ejection (coincidence between the centroids of core & knot) precedes peak of γ-ray flare by 0-20 days. Bremen COSPAR 2010
Conclusion • Analysis of γ-ray light curves from Fermi LAT data along with contemporaneous VLBA images of the parsec scale jet of blazars shows a tight connection between the mm-wave core and γ-ray events. • 2. A significant correlation between the mm-wave core and γ-ray emission variations is observed if the core undergoes a strong increase • in flux, ≥2 times, which is usually connected with a superluminal knot • passing through the core. • These suggest: • a. Gamma-rays of blazars originate in their relativistic jets. • b. A high γ-ray state is connected with disturbance(s) propagating down the jet. • c. An interaction between a disturbance and the mm-wave VLBA core appears to cause a γ-ray flare. Bremen COSPAR 2010