Download

1 / 50
540 likes | 877 Views
BAB XII (HALAMAN 141). HYPOTHESES TEST. BUDIYONO Program Pascasarjana UNS. 2010. HYPOTHESES. Statistical hypotheses, abreviated by hypotheses , is an assertion ( asersi ) or conjecture ( dugaan ) about one or more characteristics in one or more populations .

E N D
BAB XII (HALAMAN 141) HYPOTHESES TEST BUDIYONO Program Pascasarjana UNS 2010
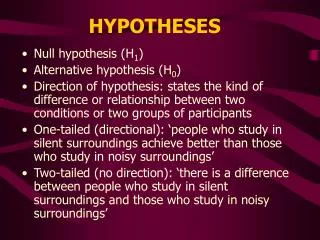
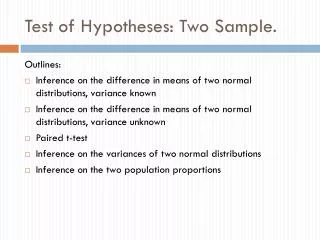
HYPOTHESES • Statistical hypotheses, abreviated by hypotheses, is an assertion(asersi) or conjecture(dugaan) about one or more characteristics in one or more populations. • There are two types of hypotheses: Null Hypotheses (hypotheses which states that there is no difference or no correlation, written using “=“, symbol H0) Alternative hypotheses(negation of null hyphotheses, symbol H1)
UJI DUA EKOR rejection region for H0 rejection region for H0 critical region critical region critical value (found from the statistical table) critical value (found from the statistical table)
UJI SATU EKOR KANAN rejection region for H0 critical region critical value (found from the statistical table)
UJI SATU EKOR KIRI rejection region for H0 critical region critical value (found from the statistical table)
Procedures for hypotheses testing 1. Write H0and H1. 2. Define the level of significance, that is, will be used to do a hypotheses testing. 3. Choose a suitable statistical test to test the hypotheses. 4. Compute the value of statistical test based on the observed data from sample. This step can be done manually or by using computer statistical package.
Procedures for hypotheses testing 5. Find the critical value and critical region based on the significance level defined. • Write the test decision about H0. Manually: If the observed statistical test in critical region, then H0is rejected. By using computer: If p , then H0is rejected. • Write the conclusion of the research based on the test decision p
Contoh 1 µ0 σ Menurut pengalaman selama beberapa tahun terakhir ini,pada ujian matematika standar yang diberikan kepada siswa-siswa SMU di Surakarta diperoleh rerata 74.5 dengan deviasi baku 8.0. Tahun ini dilaksanakan metode baru untuk dapat meningkatkan kemampuan siswa dalam bidang studi matematika tersebut. Setelah metode baru tersebut dilaksanakan, secara random dari populasinya, diambil 200 siswa untuk dites dengan ujian matematika standar dan tenyata dari 200 siswa tersebut diperoleh rataan 75.9. Jika diambil = 5%, apakah dapat disimpulkan bahwa metode baru tersebut dapat meningkatkan kemampuan siswa dalam matematika? n
α = 0.05 • 1.645
α = 0.05 • 1.645 DK
α = 0.05 • 1.645 • 2.475 DK
Contoh 2 • Untuk melihat apakah rataan nilai matapelajaran Matematika siswa kelas tiga SMU “Entah-Mana” lebih dari 65, secara random dari populasinya, diambil 12 siswa. Ternyata nilai-nilai keduabelas siswa tersebut adalah sebagai berikut. 51 71 76 81 67 98 58 69 87 74 79 81 • Jika diambil = 1% dan dengan mengasumsikan bahwa distribusi nilai-nilai di populasi normal, bagaimana kesimpulan penelitian tersebut?
α = 0.01 • 2.572 • 2.718
Contoh 3 • Seseorang ingin menunjukkan bahwa siswa wanita dan siswa pria tidak sama kemampuannya dalam matematika. Untuk itu, ia mengambil 12 wanita dan 16 pria sebagai sampel. Nilai-nilai mereka adalah: Wanita : 51 71 76 81 67 98 58 69 87 74 79 81 Pria : 68 72 77 79 68 80 54 63 89 74 66 86 77 73 74 87 • Jika diasumsikan bahwa sampel-sampel tadi diambil dari populasi-populasi normal yang variansi-variansinya sama tetapi tidak diketahui, dan dengan =5%, bagaimana kesimpulan penelitian tersebut?
Soal Nomor 1 Biasanya rerata berat mangga jenis tertentu adalah 0.80 kg dengan deviasibaku 0.05 kg. Distribusi berat mangga dianggap normal. Namun pada suatu masa panen tertentu, diduga berat mangga jenis tersebut menurun. Untuk melihat apakah benar dugaan tersebut, diambil 100 buah mangga. Setelah ditimbang ternyata rerata beratnya 0.75 kg. Jika diambil = 1%, bagaimana hasil penelitian tersebut?
Solusi • H0: µ≥ 0.80 (berat mangga tidak menurun) • H1: µ < 0.80 (berat mangga menurun)
Soal Nomor 4 • Seorang peneliti ingin melihat apakah anak laki-laki mempunyai prestasi yang lebih baik daripada anak perempuan. Peneliti tersebut mengambil 15 anak laki-laki dan 21 anak perempuan sebagai sampel penelitian. Setelah diberikan tes yang sama, rerata anak laki-laki adalah 75 dengan deviasi baku 12 dan rerata anak perempuan adalah 73 dengan deviasi baku 10. Dengan mengambil = 5% dan dengan meng-asumsikan bahwa variansi kedua populasi sama, bagaimana kesimpulan penelitian tersebut?