Download
1 / 54
540 likes | 648 Views
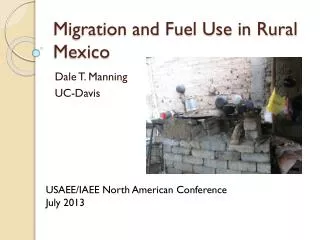
Migration, Violence and Welfare in rural Colombia. by Alice Mesnard, IFS Orazio Attanasio, UCL, IFS. Introduction. Civil conflict has displaced many families and individuals from their villages of origin. 4.3% pop., 14% rural (Arboleda and Correa, 2003)

E N D
Migration, Violence and Welfarein rural Colombia by Alice Mesnard, IFS Orazio Attanasio, UCL, IFS
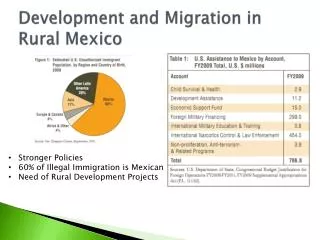
Introduction • Civil conflict has displaced many families and individuals from their villages of origin. 4.3% pop., 14% rural • (Arboleda and Correa, 2003) • Costs are large : assets, inadequate human capital, poverty… • Policy makers have shown an increasing interest in building interventions to curb these flows
Objectives • Understand the determinants of mobility decisions in a violent context • We embed new motives related to violence, community characteristics, and policy interventions in the framework of economic migration • Do traditional motives for economic migration apply in a violent context? • How do welfare programmes affect household migration in such context ? • Our concept of mobility differs from displacement. • Migration decisions are not necessarily entirely forced but are likely to be affected by high intrinsic violence levels in rural villages: how do these factors interact? • We also compare ‘stayers’ with ‘movers’
Road map • Review of literature on migration, violence and welfare • Data and samples • Model of household migration with selection • Does violence modify migration incentives? • Understanding better the impact of violence and welfare programme on migration • Other migration determinants • Compare a sample of poor individuals from small towns with a sample of displaced individuals from similar towns • Policy implications and future extensions
1 Motivation of the empirical model • Traditional literature Harris and Todaro (70) Human capital theory (Sjaastad 62, Becker 64) or in uncertain environment (Da Vanzo 83, Pessino, 91) New economic of migration (Stark, 91): within household Importance of networks (Massey and al., Munshi, 2003, Munshi and Rosenzweig, 2005 ) • Literature on violence and migration Schultz 71, Morrison and May 94 : effects of violence on internal migration in Colombia and Guatemala Displacement and asylum seekers (Azam and Hoeffler, 2002, Hatton...) Engel and Ibanez (2005) : displacement differs from migration. • Literature on welfare programmes and migration: scant ! Angelucci (2005): impacts of PROGRESA on international migration
Contribution • Microeconomic underpinnings of household migration Number of factors : social capital, risk exposure, shocks, liquidity constraints, violence, policy interventions... • We allow the violence to affect not only household well-being directly but also to affect the incentives associated to other migration factors • In particular policy interventions may have different impacts on migration depending on violence level
Potential impacts of welfare programmes ? • side effect of Conditional Cash Transfer programmes (-) Benefits deter households to move out of “Treated” town Mitigate aggregate risk, spill-over effects… (+) Cash transfers help relax liquidity constraints. Their conditionality may mitigate this effect. • Heterogeneous impacts of the programme if violence is low (-) if violence is high (+)
The Familias en Acción Programme • Familias en Acción (FeA) is a CCT implemented in Colombia in 2002. • The programme is modeled after the Mexican Oportunidades/ PROGRESA intervention • It consists of: • a health and nutrition component (46500 monthly pesos conditional on participation in health component) • an education component 14000/28000 conditional on primary/secundary school enrolment and attendance • The transfer is targeted to mothers • The program started in 627 municipalities (small towns with enough infrastructure) and is now being expanded considerably. • It is projected that about 1.5 million households will be in the programme by the end of next year.
The Familias en Acción Survey • A consortium formed by IFS and two Colombian entities won the contract to evaluate the effects of the program. • For this reason a large data operation was started in 122 towns : 57 treatment and 65 control. • The allocation was not random • A sample of 11,500 household was drawn from the SISBEN 1 lists of December 1999 and interviewed in 2002. • To achieve a sample of that size, an initial sample of about 19,000 household was drawn from the same lists. • Of these, 11,500 were still living in the same town (and eligible for the programme) • A large number of households were lost because of high mobility.
The Familias en Acción Survey • Baseline collected between June and November 2002 • Very rich and exhaustive household survey (3.5 hours on average • It includes information on consumption, income, education, time use, shocks, attitudes, expectations and so on and so forth. • In some of the treatment towns the programme started before the baseline (TCP and TSP) • Survey was complemented by other smaller surveys • Schools, health care centres, community nurseries, local authorities, locality surveys. • The towns are clearly affected by violence and the civil war: • Hard evidence (matching with municipality level panel data on violence – DNP) • anecdotes
The Familias en Acción Survey • The follow up survey was planned (and executed) in 2003. • Given the high level of mobility between 1999 and 2002 we were very worried about attrition. • We also thought that the survey gave us a unique opportunity to study the mobility of a very vulnerable population in the places where they lived. • We obtained funds from the IADB to invest in tracking households down and to study mobility and violence. • Three components: • Tracking down movers Special module on movers. • Much more in depth interview with local authorities on violence and mobility • Social capital games piloted in 12 villages.
The Familias en Acción Survey • Mobility went down considerably. • Attrition was only 6% • 2,026 households changed address between treatment and follow up. • 1,316 within village • 710 outside village • 114 were tracked down • 596 were lost • 275 moved for unknown reasons • 114+321 moved to different municipalities. • Most of the 321 who were lost moved to big cities.
Reasons for migration Notes: in (%) of answers
Costs of migration Migration costs are high for very poor households: median costs = 50,000 pesos, mean costs = 103,037 pesos i.e. 21% and 43% of average monthly income To finance their migration none relied on credit or loans ! (2/3 used own funds, 1/3 was helped by friends). However, past migration flows are estimated around 10-15% per year.
Why are there potential problems of selection ? 3 Model of migration with selection • 40 % of households registered as very poor in 1999 were sampled for the FA survey but are not in the baseline survey in July 2002. • So, possibly, the households in the baseline sample are selected on unobservable characteristics that make them least mobile. • In this case, migration determinants may be biased
Estimation of the model : Simultaneous estimation of migration equation : : with selection equation
Determinants of selection equation • Use data on all households registered in the municipalities in 1999 for the SISBEN survey • We need at least one instrument that we can exclude from the migration equation • Instruments : number of victims, kidnappings, displaced individuals per 10,000 inhabitants before 1999 source: National Police data matched at municipality level
Results of selection equation Notes: Coefficients obtained with a Probit model, number of observations 19148
Results of the migration equation Notes: Standard deviations in parentheses, * significantly different from column (1)
Main results : Wald test of independence rejects the significance of ρat 31% level (Chi Square(1) =1.04)
Effects of programme and violence Notes: Column (2) adds proxies for occupation of household head
4 Does violence incidence modify migration motives ? Q1: does the programme impact depend on the level of violence ?
heterogeneous impacts of programme Notes: “high level” defined Left : by presence of ELN, FARC, paramilitaries in municipality Right: number of displaced households >5 (most violent quartile) Results of specification 1 :
Results of specification 2 : Notes :“Violence” is measured by number of displaced households before the survey Column (2) adds the controls for occupations of household heads column (3) adds controls for social capital
Programme impact depends on violence level… Note: points represent municipalities
Robustness checks • Heterogeneous impact of programme along violence measured by presence of illegal forces (dropping 5 extreme values) Direct impacts of violence (Presence of a curfew) : 1.186** (0.454) Direct impact of programme : -2.135***(0.580) Interaction impact of programme*violence: 1.367** (0.628) • Dropping the municipalities with extreme levels of violence
Q2. Do other migration motives depend on violence? No significant heterogeneous impacts along: • Household social position in village (edu. levels, social capital) • Working in agriculture • Living in rural, more isolated parts of municipalities But households with larger size, smaller proportion of children, whose head is older respond more strongly to violence.
Understanding better the impact of violence and welfare programme • Is the impact of violence similar to other negative shocks on household income ? • Is there more evidence for liquidity constraints ? • Do they affect differently household migration depending on violence incidence ?
Is the impact of violence similar to other negative shocks on household income ? Households may respond more strongly to aggregate (village) shocks than to idiosyncratic shocksDescription of negative shocks on household income :
Is there more evidence for liquidity constraints ? • Household wealth measured by lots of variables : quality of walls, education of household head and spouse, owning a house, phone, sewage system ... We look at the effect of • Net value of property • Net stock of savings • Net wealth=net value of ppty + Net stock of savings
Magnitude? • Median net wealth : 1+e6 • Mean : 3.52325 +e6 • Std. Dev.: 7.42107 +e6 • Increasing net wealth by median net wealth would increase probability to migration by 0.04 percentage points • Increasing net wealth by one standard deviation would increase it by less than 0.3 percentage points
6 other determinants of migration Effect of wages: Notes : Marginal effects of a Probit model , 1,000 pesos represents more than 1.5 standard deviations from mean hourly wage 100,000 pesos = 40% of monthly income of very poor households in treated municipality Standard errors in parenthesis. *** significant at 1%, ** significant at 5%, * signi at 10 % (1) household and municipality characteristics (2) dropping some municipality level characteristics (3) more education levels for household head and spouse (4) adding occupation of household heads and spouse (5) adding social capital
Other Municipality factors • Altitude increases the probability to migrate • Regional characteristics have significant impacts • No significant impact of social capital • Weak impacts of infrastructure: health, education, sewage and water Household characteristics • (-) Size of households (quadratric effect) • (+) household head is single (0.8) • Education levels have no significant impacts But occupations have strong impact: (-) agriculture (-) self-employed, employed and employer
Strong effects associated to property rights… Notes: Omitted category = house is owned
Strong effects associated to type of insurance Notes : in Column (2) we add proxies for occupation of the household head and spouse 4% households have type 1 insurance 69% households have type 2, 10 % are not insured.
Comparing ‘stayers’ and ‘movers’ • So far we have analyzed mainly the FeA sample and focused on the features of households who are in their villages in 2002 • We now compare these households with a sample of households that were displaced. • This data is taken from a survey of displaced individuals contacted in several large cities in Colombia by Econometria within a study of food security. • We restrict the sample to displaced individuals coming from the same regions and type of municipalities in the FeA sample.
Table 8: household composition of displaced and non displaced households Note: the non-displaced households are from the FA survey.
Table 10: Number of deaths in the household during the last 12 months
Distribution of total expenses of displaced and non-displaced households