Download
1 / 26
260 likes | 262 Views
Welfare Dynamics in Rural Kenya and Madagascar. Christopher B. Barrett, Paswel P. Marenya, John McPeak, Bart Minten, Festus Murithi, Willis Oluoch-Kosura, Frank Place, Jean Claude Randrianarisoa, Jhon Rasambainarivo and Justine Wangila November 14-15 2003

E N D
Welfare Dynamics in Rural Kenya and Madagascar Christopher B. Barrett, Paswel P. Marenya, John McPeak, Bart Minten, Festus Murithi, Willis Oluoch-Kosura, Frank Place, Jean Claude Randrianarisoa, Jhon Rasambainarivo and Justine Wangila November 14-15 2003 USAID BASIS CRSP Pre-conference Workshop on “Combatting Persistent Poverty in Africa” Cornell University, Ithaca, NY
Why is poverty so persistent in rural Africa? The design of appropriate strategies to combat persistent poverty depend on its origins. Is poverty something … … all people naturally grow out of in time (unconditional convergence)? … implies laissez- faire or general support for economy. … some people grow out of in time (conditional convergence)? … implies need for cargo nets. … some people can be trapped in perpetually (poverty traps due to multiple equilibria)? … implies need for safety nets and cargo nets.
Well-beingt+1 W3 W2 Pov. line W* W1 Well-beingt W* Poverty line W1 W2 W3 Brief theoretical background: The poverty traps possibility Figure 1: Welfare Dynamics With Multiple Equilibria Key: nonlinear path dynamics with multiple stable dynamic equilibria and at least one unstable dynamic equilibrium (threshold)
Well-beingt+1 W2 Pov. line Well-beingt W2 Brief theoretical background: The slow convergence possibility Figure 1: Welfare Dynamics With Unconditional Convergence Key: unique, common path dynamics with a single stable dynamic equilibrium
Brief theoretical background: The conditional convergence possibility Well-beingt+1 High group W3 Pov. line Low group Well-beingt W3 W1 Figure 1: Welfare Dynamics With Conditional Convergence Key: unique path dynamics with a single stable dynamic equilibrium for distinct groups or individuals
Why bother with the theory? These three alternative theoretical foundations for understanding persistent poverty carry very different policy implications. - safety nets as poverty alleviation? - need for targeting? - need for patience? So it seems desirable to try to get a firmer handle on the etiology of persistent poverty. That’s the objective of this paper.
Methodological challenges of studying welfare dynamics Qualitative vs. quantitative methods? Within each (esp. w/n quantitative) … which metric? … what point of comparison (poverty line and poverty measure)? … how to control for inflation, FX rate changes? … how to control for (changing) household demography? … how to control for attrition? Given methodological fragility of any given method, we try to triangulate using different quantitative methods and by integrating qualitative and quantitative methods.
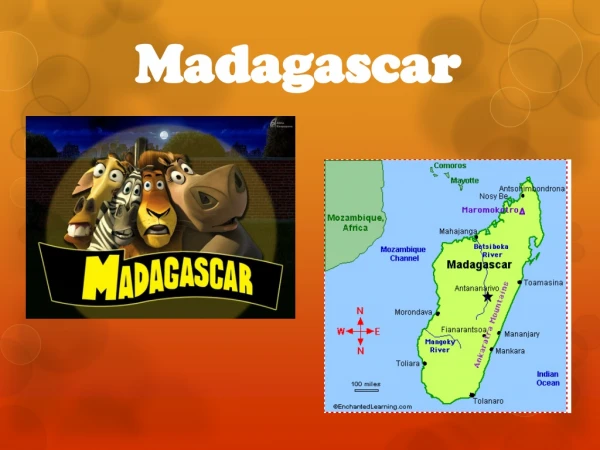
Data and Site Description Household-level panel data constructed for 7 sites, building on previous surveys (not nationally representative) Stratification: Better-worse market access Wetter-drier agroecology •Antsirabe 1= Embu (n=113) 5 = Dirib Gombo (Marsabit) (n=30) 2= Madzuu (Vihiga) (n=89) 6 = Fianarantsoa (n=58) 3 = Siaya/Vihiga (n=103) 7 = Vakinankaratra (n=94) 4= Ng’ambo (Baringo) (n=30) N = 517
Qual-Quant Integration Community focus group discussions, key informant interviews, and in-depth, open-ended household interviews (oral histories) based on sampling from 8 cells/sub-cells of ultra-poverty transition matrices
Economic Mobility and Poverty Dynamics Ultra-Poverty Transition Matrices As measured against $0.50/day per capita income poverty line Kenya rural poverty line ~ $0.53, Madagascar poverty line ~ $0.43
Estimated annual gross (net) poverty exit rates Estimate using mobility transition probability: PRt = mt PR0 SiteGrossNet Dirib Gombo: 0.0% (0.0%) Madzuu: 2.2% (1.0%) Fianarantsoa: 2.3% (0.7%) Vakinankaratra: 2.4% (-4.2%) Ng’ambo: 5.2% (4.1%)
Caveat on income measures How robust is the transition matrix to changing definitions of poverty? Not very. Have to be careful! Comparison of 2000-2002 Poverty Transition Rates Using Different Measures Siaya-Vihiga Villages
Moving beyond headcount measures We want to know the directions and magnitudes of welfare change, not just discrete movements relative to an arbitrary poverty line. Annual average percent change in income, by site and resurveying interval
Filtered vs. unfiltered income change regressions Unfiltered: Y = A`[r + εR] + U + εT + εM (2) dY = dA `[r + εR] + A`[dr +dεR]+ dεT + dεM (4) includes measurement error … negative bias Filtered: E{Y} = A`r + U (3) E{dY} = E{dA}`r + A`E{dr} (5) omits true stochastic component of income … positive bias Regress dY on Y, E{dY} on E{Y}, or both to bracket?
Site-specific filtered and unfiltered income change regressions: It clearly makes a difference
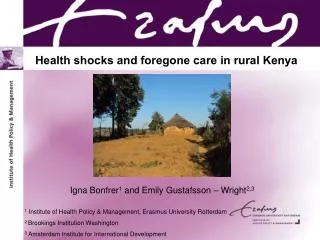
Qualitative Evidence on Economic Mobility and Poverty Dynamics Complementary qualitative work strongly suggests multiple equilibria/poverty traps or conditional convergence, depending on who one asks, the poor or the nonpoor: (1) The nonpoor describe conditional convergence. Individual attributes (work ethic, drunkenness, etc.) lead to long-term differences. (2) The poor describe poverty traps, emphasizing the role of asset shocks in explaining observed mobility. Health shocks (chronic or transitory disease, death and resulting funeral expenses) especially important, but also livestock shocks (e.g., raids or disease) and land shocks (e.g., costly disputes). Higher-return activities beyond their reach given entry barriers to remunerative livelihoods.
Summary of Findings on Economic Mobility and Poverty Dynamics • Considerable persistence of ultra-poverty with low rates of net exit from poverty • Poverty deepest where agroecology and markets least favorable (“remote rural areas” or “less favored lands”) • Stochastic component of income appears substantial • Whether by quantitative methods, with some effort to filter out measurement error, or by qualitative methods, the hypothesis of unconditional convergence seems hard to support. Not at all clear whether the conditional convergence or poverty traps hypotheses, or both, best explain these data.
Does Economic Immobility Signal Poverty Traps? 1) Risk-taking and consumption smoothing behaviors Wealth-dependent risk management among northern Kenya pastoralists
Does Economic Immobility Signal Poverty Traps? 1) If income variability increases with wealth, so should returns on assets. Indeed, the income-herd size relation exhibits increasing returns, consistent with risk-based poverty traps:
Does Economic Immobility Signal Poverty Traps? 2) Barriers to entry into higher-return activities - educational attainment and rationing - lack of credit and liquid savings (negligible credit access) … limited capacity to enter higher-return businesses or even to buy livestock - pastoralist mobility depends on herd size … expected result is nonlinear asset dynamics, with rapid accumulation beyond key thresholds
Does Economic Immobility Signal Poverty Traps? The asset data appear consistent in the Kenya sites with multiple equilibria, but in the Madagascar sites, conditional convergence seems to fit better. Herd Dynamics in Northern Kenya Asset Index Dynamics
Does Economic Immobility Signal Poverty Traps? Same with the income data. Multi-modal income distribution in Madzuu. 2002 Income Distribution in Madzuu • Consistent with qualitative evidence: • Importance of non-farm salaried employment, incl. to agricultural intensification • Fragility of non-poor status, esp. to health shocks
Does Economic Immobility Signal Poverty Traps? But unimodal distribution in Madagascar reflective more of conditional convergence with significant geographic grouping. Implied dynamic real income equilibria: Vakinankaratra ~ $0.61 Fianarantsoa ~ $0.33 Latter seems a geographic poverty trap
Conclusions and Policy Implications 1) Evidence seems to point rather strongly against the unconditional convergence hypothesis on which neoliberal reforms of the 1990s were implicitly based, which implies all households naturally grow out of poverty in time. 2) Qualitative and quantitative evidence inconclusive as to whether the conditional convergence, poverty traps or both hypotheses are accurate. Cross-sectional differences at community level appear consistent with the conditional convergence hypothesis. 3) Geographic targeting would thus seem useful in targeting interventions intended to stimulate growth and higher equilibrium productivity/income levels.
Conclusions and Policy Implications 4) Evidence on within-community differences associated with conditional convergence appears weaker, although the nonpoor certainly claim this to be true. 5) There certainly seem cases in Kenya – the evidence is less supportive in Madagascar – of poverty traps, multiple dynamic equilibria between which households can shift. This places a premium on effective, pre-set safety nets to keep people from falling into lower-level equilibria.