Download
1 / 21
210 likes | 440 Views
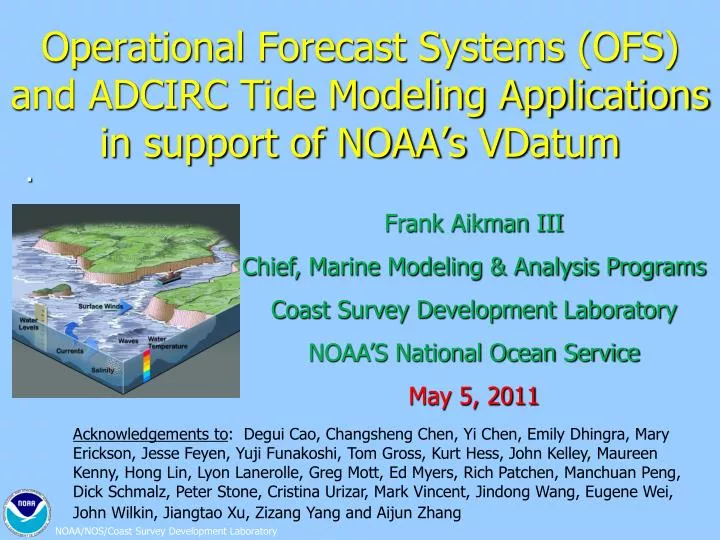
Operational Forecast Systems (OFS) and ADCIRC Tide Modeling Applications in support of NOAA’s VDatum. Frank Aikman III Chief, Marine Modeling & Analysis Programs Coast Survey Development Laboratory NOAA’S National Ocean Service May 5, 2011.

E N D
Operational Forecast Systems (OFS) and ADCIRC Tide Modeling Applications in support of NOAA’s VDatum Frank Aikman III Chief, Marine Modeling & Analysis Programs Coast Survey Development Laboratory NOAA’S National Ocean Service May 5, 2011 . Acknowledgements to: Degui Cao, Changsheng Chen, Yi Chen, Emily Dhingra, Mary Erickson, Jesse Feyen, Yuji Funakoshi, Tom Gross, Kurt Hess, John Kelley, Maureen Kenny, Hong Lin, Lyon Lanerolle, Greg Mott, Ed Myers, Rich Patchen, Manchuan Peng, Dick Schmalz, Peter Stone, Cristina Urizar, Mark Vincent, Jindong Wang, Eugene Wei, John Wilkin, Jiangtao Xu, Zizang Yang and Aijun Zhang
Outline • The state of NOS’s Operational Forecast Systems • Requirements and geographic coverage • CBOFS example and NGOFS regional approach • OFS products & dissemination • The Coastal Ocean Modeling Framework (COMF) • OBJECTIVE:More efficient R&D, O&M • VDatum • Present Coverage and Future Plans • New Software Release
SST Salinity NOS Marine Modeling Requirements • Support of safe & efficient navigation • Water levels for under-keel clearance • Currents for right-of-way, maneuverability • Emergency response • HAZMAT • Homeland Security • Search & Rescue • For environmentally sound management of the coastal zone • Ecosystem applications • Marine geospatial applications
Chesapeake Bay Operational Forecast System (CBOFS) CBOFS (3-D) Operational 04/11 Currents Temp Salt CBOFS (2-D) Operational 08/01
Specification of Environmental Conditions for CBOFS Weather Forecast Models NOS NWLON NAM /WRF/NDFD USGS Gages/NWS RFC’s Basin or global ocean models
Development of a northern Gulf of Mexico Operational Forecast System ( NGOFS) Represents the transition to a regional modeling approach. Nested versions of the FVCOM model will be applied to cover six PORTS with a single OFS.
NOS Coastal Operational Forecast System Products Graphics on CO-OPS Web Site • Water levels, currents, temperature, salinity, and surface winds at selected locations • Time series plots of selected locations, contour and vector map plots, animations Model data sets on NOAA’s WOC and CO-OPS THREDDS • Station/point netCDF files (6-minute output): • Time series at selected stations • Gridded model output netCDF files (hourly output) Model visualization via nowCOAST GIS-Based Web Mapping Portal (WMS) Users value usefulness, accessibility, reliability • Outputs used by USCG, NOS/OR&R, ASA, etc. in real-time • Web products used daily by coastal managers, maritime, navigation and emergency response communities. • Reliability and timely delivery of products are most important.
Individual Model systems NOS Coastal Ocean Modeling Framework (COMF) OPERATIONAL MODELS (NOAA’s HPC) REAL-TIME DATA INGEST QA/QC (COMF) • Data Tank on CCS: • Atmospheric Forcing • Coastal Boundary Conditions • Riverine Fresh Water Inputs Products and archives Linux Server in CO-OPS FORECAST MODEL GUIDANCE (water level, water temp, currents, & salinity) PRODUCTS (web pages and digital pt. & gridded data) FOR USERS tidesandcurrents.noaa.gov QA/QC (CORMS) 24 x 7 *Consistent with IOOS (DMAC); the Earth System Modeling Framework (ESMF); and COARDS/CF Conventions
Coastal Ocean Modeling FrameworkConsists of middleware to manage workflow OBJECTIVE:More efficient R&D, O&M PURPOSE: • Simplify Data Handling & Maintenance • Provide a Standard System for all Locations (NetCDF) • Share Skill Assessment and Evaluation Tools • Enable an efficient technology-transfer process • Various Models Allowed For Experimentation • ADCIRC, ECOM, EFDC, ELCIRC, FVCOM, POM, SELFE, QUODDY, ROMS • NOS selected two or three “corporate” models to move forward with • For OFS: Structured Grid - ROMS; Unstructured Grid – FVCOM • For VDatum Tidal Modeling and Storm Surge - ADCIRC Consistent with IOOS (DMAC); the Earth System Modeling Framework (ESMF); and COARDS/CF Conventions
Prototype Test Bed: The Delaware Bay Model Evaluation Environment (DBMEE) Bridgeton Maurice River Cape May Cape Henlopen Bathymetry Grids Metrics Model Hindcast COMMUNITY MODELS ROMS, POM, ADCIRC, FVCOM, ELCIRC, SELFE, .... Historical Data Environmental conditions Grids, Bathymetry, Environmental conditions
SST Likelihood Of Chrysaora Salinity NOAA/NOS Coastal Modeling Challenges • Continued/Active Collaboration with the Ocean Modeling Community • Transition from individual port models to a regional modeling approach • Coupled Model Systems: • Riverine-estuarine-regional/coastal-basin; • Hydrodynamic-wave; hydrodynamic-sediment transport • Physical-biogeochemical coupling (ecological; water quality; habitat) • HABs (Red Tide) in Gulf of Mexico • Hypoxia in the Chesapeake Bay and Northern Gulf of Mexico Shelf • Forecast uncertainty estimation • Probabilistic approach/Ensemble averaging • Data assimilation techniques • HF Radar; coastal altimetry; SST; IOOS data; etc. • Higher spatial resolution in key areas (e.g. in navigation channels; for storm surge and inundation modeling) • Nesting vs. unstructured grids; • Finite difference, finite element and finite volume approaches
ADCIRC Tide Modeling Applications in support of NOAA’s VDatum Program
VDatum Coverage ` To Be Completed July 1, 2011 • Next Steps: • Puerto Rico/Virgin Islands, 2012 • Model development & base data acquisition in Alaska
Why ADCIRC for VDatum? • It is used to simulate the tides in order to reproduce spatially varying tidal datums. • Grids are composed of triangular elements of varying sizes, allowing larger elements to be used in deep waters (where tidal wavelengths will be longer) and smaller elements in shallow depths (shorter wavelengths and better resolution of nearshore features). • ADCIRC has been thoroughly tested and applied to a variety of benchmark and circulation studies. • We are using the 2D depth-integrated version of ADCIRC, as we are not resolving the vertical structure of the velocities or computing temperature and salinity. These barotropic 2D simulations run much faster than 3D models. • It has an MPI version, allowing us to run large grids using the High Performance Computing resources at NOAA’s ESRL facility in Boulder. • Excellent user group community and model support. ADCIRC is a proven “community model”. www.adcirc.org
Where is ADCIRC used in the VDatum “Roadmap”? Orthometric Datums 3D Datums Tidal Datums Calibrated Helmert Transformations WGS 84 (G1150) NGVD 29 WGS 84 (G873) Tide Models WGS 84 (G730) MHHW WGS 84 (orig.) VERTCON MHW ITRF2000 ITRF97 MTL ITRF96 NAD83 (NSRS) NAVD 88 LMSL ITRF94 DTL ITRF93 ITRF92 MLW ITRF91 ITRF90 GEOID99, GEOID03 MLLW ITRF89 TSS (Topography of the Sea Surface) ITRF88 SIO/MIT 92 NEOS 90 PNEOS 90
Higher High Water High Water Low Water Lower Low Water Generation of Tidal Datum Fields ADCIRC model is used to generate time series of the tides at each grid point. • Final tidal datum fields are corrected to match observations at CO-OPS water level stations. • Corrections are made using TCARI, an interpolation tool based on solution of Laplace’s equation. Tidal datums are computed from the time series at each grid point.
Interpolation by Laplace’s Equation: ∆2f = 0 Subject to boundary conditions: f(xi, yi) = fiobs f = datum, amp, cos(phase) ∂f/∂n = a∂f/∂n TCARI Tidal Constituent And Residual Interpolation TCARI-Corrected Datum Fields TCARI Interpolation Corrected TCARI of Datum Tide Model Interpolation of Error San Francisco Bay
Tide Modeling Grids in Support of VDatum Gulf of Maine New York/LI Sound North Carolina Florida, Southeast US Texas, Western Louisiana
New Version of VDatum Software • Incorporates regional polygons to better define areas • For areas with differing tidal characteristics • Delineating borders between adjacent regions • Excluding highly changeable regions • Solves issue of overlapping grids • Automatically selects correct region • Identifies if additional regions need to be downloaded
Development of Community Tools: NOAA’s Unstructured Grid Catalog