Download
1 / 81
950 likes | 1.66k Views
Analysis of Complex Survey Data and Survival Analysis. This session will cover an overview of issues in analysis of complex sample data and illustrate use of some of these concepts using CPES data Analysis topics demonstrated with complex sample data adjustments during the CPES training

E N D
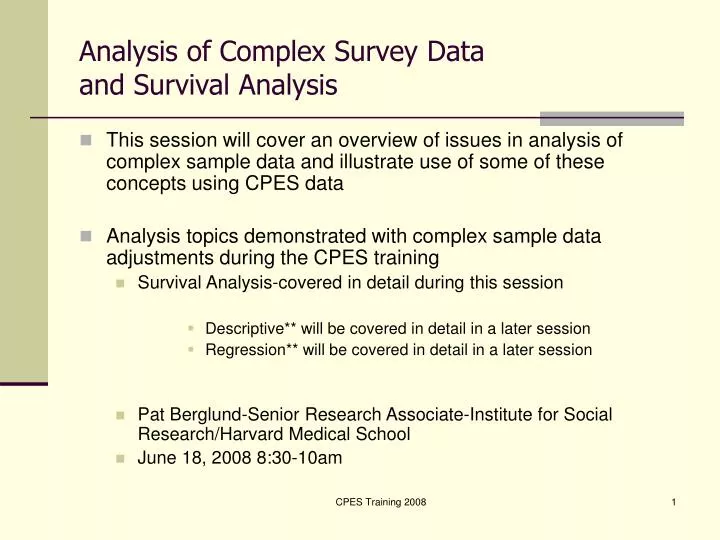
Analysis of Complex Survey Dataand Survival Analysis • This session will cover an overview of issues in analysis of complex sample data and illustrate use of some of these concepts using CPES data • Analysis topics demonstrated with complex sample data adjustments during the CPES training • Survival Analysis-covered in detail during this session • Descriptive** will be covered in detail in a later session • Regression** will be covered in detail in a later session • Pat Berglund-Senior Research Associate-Institute for Social Research/Harvard Medical School • June 18, 2008 8:30-10am CPES Training 2008
CPES Overview • This section will focus on the CPES surveys • Overall sample design • CPES instruments (NCS-R, NSAL, NLAAS) • Weights • Complex sample features and variables CPES Training 2008
Key WebSites • Along with the CPES website as the starting point each project has their own site • NCSR: www.hcp.med.harvard.edu/ncs • NSAL: http://www.rcgd.isr.umich.edu/prba/nsal • NLAAS: http://www.multiculturalmentalhealth.org/nlaas.asp • Other useful sites for analysis of complex survey data: SAS: www.sas.com Stata: www.stata.com Sudaan software: www.rti.org/SUDAAN/ SPSS software: www.spss.com Iveware software: www.isr.umich.edu/src/smp/ive R software: http://www.r-project.org/ Mplus software: http://www.statmodel.com/ Wesvar software: http://www.westat.com/wesvar/ CPES Training 2008
Overview of Public Release Dataset • All raw and selected diagnostic, demographic, sample design and weight variables are included in one file, overall n= 20113 • NCS-R has 2 sections • n=9282 for the entire part 1 sample with a sub-sample of respondents that completed part 2 of the instrument, n=5692 part 2 respondents • Raw variables-includes all variables that could be released while keeping disclosure issues in mind • Diagnostic variables-includes selected diagnostic variables such as ICD and DSM disorders along with age of onset, age of recency, lifetime, 12 month disorders, and 30 day disorders CPES Training 2008 continued...
Overview of Public Release Dataset • Demographic variables-includes selected demographic and design variables • The dataset can be downloaded in various formats such as SAS transport, ASCII with SAS, SPSS, or Stata setup statements • Associated documentation tools • online and Adobe/pdf format codebook • Adobe/pdf format of the instrument • SDA analysis system • Other tools are related literature links and background information on the study and analysis tips including sample programs CPES Training 2008
Survey Instruments • NSAL and NLAAS have one section in their respective instrument while the NCS-R has 2 sections • The instruments can be viewed from the CPES website • Under “Interactive Documentation” and then “Sample Design” • The key point here is that each survey is a “complex” survey based on stratified/multi-stage/probability samples • These samples should be analyzed with techniques that take the complex sample design into account CPES Training 2008
Sample Design Information CPES Training 2008
CPES Sections CPES Training 2008
NCS-R Instrument - Sections and Flow The NCS-R instrument is divided into 2 parts • Part 1 includes sections 1-14 with an additional demographic section for those that do not go on to complete Part 2 • Part 2 includes detailed questions about additional disorders such as gambling disorder, childhood disorders such as conduct disorder and ADD, social networks, family history/risk factors and other detailed sections such as finances • At the end of the Pharmacoepidemiology section, a series of questions directing flow into Part 2 of the survey are included, other key flow questions are included in the Screener section and these are referenced in the Pharmacoepi section as well CPES Training 2008
Flow into Part 2 of Interview • Questions at the end of the pharmocoepi section channel respondents to various sections of the questionnaire • These questions are related to the screening questions of the Screener section (see instrument instructions) • Overall strategy of using the Screener section is detailed in the paper “The World Mental Health (WMH) Survey Initiative Version of the World Health Organization (WHO) Composite International Diagnostic Interview (CIDI)”, RONALD C. KESSLER, T. BEDIRHAN ÜSTÜN CPES Training 2008
Rationale for 2 Parts to NCS-R Instrument • Interview Length and Analysis content (see Kessler Design and Field paper) “Part II included assessments of risk factors, consequences, services, and other correlates of the core disorders. Part II also included assessments of additional disorders that were either of secondary importance or that were very timeconsuming to assess. Part II was administered only to 5,692 of the 9,282 NCS-R respondents, over-sampling those with clinically significant psychopathology. All respondents who did not receive Part II were administered a brief demographic battery and were then either terminated or sampled in their appropriate proportions into sub-sampled interview sections that are described below.” CPES Training 2008
CPES Sample Design • The CPES is a combination of 3 surveys and thus each sample design should be considered when using the combined data set • What are elements of design for each survey and how was this accounted for in the CPES combined file? • Implications for analysis when using the combined file? • Implications for analysis when using each separate file? • Our focus is on the CPES analyzed as a combined data set CPES Training 2008
NCSR Sample Design • Nationally representative multi-stage clustered area probability sample of households. Interviewed people in the age range 18 years and older, rather than in the NCS-1 age range of 15-54. The exclusion of the 15-17 age range was dictated by carrying out a separate NCS Adolescent survey of 10,000 respondents in the age range 13-17. The inclusion of the age range 55 years and older was based on the desire to study the entire adult age range. Part II was administered only to 5,692 of the 9,282 Part I respondents, including all Part I respondents with a lifetime disorder plus a probability subsample of other respondents. • See Kessler, Ronald C.; Berglund, P.; Chiu, W.T.; Demler, O.; Heeringa, S.; Hiripi, E.; Jin, R.; Pennell, B.E.; Walters, E.E.; Zaslavsky, A.; Zheng, H., "The US National Comorbidity Survey Replication (NCS-R): Design and field procedures." International Journal of Methods in Psychiatric Research. 2004, 13, (2), 69 - 92. CPES Training 2008
NSAL Sample Design • The NSAL survey populations included all US adults in the three target groups who were age 18 and older and resided in households located in the coterminous 48 states. The African-American survey population included only Black adults who did not identify ancestral ties in the Caribbean. The Afro-Caribbean survey population was limited to Black adults who self-identified as being of Caribbean ancestry. The White survey population included all Caucasian adults except persons of self-reported Hispanic ancestry. Institutionalized persons including individuals in prisons, jails, nursing homes, and long-term medical or dependent care facilities were excluded from the study population. Military personnel living in civilian housing were eligible for the study but residents of housing located on a military base or military reservation were excluded. The NSAL survey populations were restricted to adults who were able to complete the interview in English. • See CPES website for more details. CPES Training 2008
NLAAS Sample Design • The National Latino and Asian American Study (NLAAS) is a nationally representative community household survey that estimates the prevalence of mental disorders and rates of mental health service utilization by Latinos and Asian Americans in the United States. The central aims of the NLAAS were threefold. First, to describe the lifetime and 12-month prevalence of psychiatric disorders and the rates of mental health services use for Latino and Asian American populations using nationwide representative samples of these groups. Second, to assess the associations among social position, environmental context, and psychosocial factors with the prevalence of psychiatric disorders and utilization rates of mental health services. Third, to compare the lifetime and 12-month prevalence of psychiatric disorders, and utilization of mental health services of Latinos and Asian Americans with national representative samples of non-Latino whites (drawn from the National Comorbidity Study-Replication (NCS-R) and African Americans (drawn from the National Survey of American Life (NSAL). • See CPES website for more details. CPES Training 2008
Considerations for Analysis of the CPES Analysis Considerations • Weights • Weights and the sample design must be considered when analyzing the CPES data, either as a combined file or as a subset of the 3 surveys • Weights are included for a number of combinations of the surveys and we focus on use of the full CPES data set • Sample Design • Due the clustering of the CPES combined sample designs, variance estimation from standard software procedures is incorrect since it assumes a simple random sample • In general, variance/SE’s and hypothesis tests will be under estimated due to clustering and stratification along with weighting CPES Training 2008
CPES Weights • Each of the 3 data sets are weighted to adjust for differential probabilities of selection of respondents within households and differential non-response as well as to adjust for residual differences between the sample and the United States population. • An overall CPES weight is available and should be used for combined analysis • An additional weight was developed for the NSAL and NLAAS to match the NCSR Part 2 weight construction • It is essential that the analyst account for the complex sample design and use the correct weights in every analysis • See CPES website for details on each survey’s weight construction CPES Training 2008
Why Use Weights? • Weighting is used to compensate for: • Unequal probabilities of selection • Nonresponse (typically, a unit that fails to respond) • In poststratification to adjust weighted sample distributions for certain variables (e.g., age and sex) to make them conform to the known population distribution. • It is used to improve the accuracy (minimize bias) of sample estimates and to compensate for noncoverage and nonresponse CPES Training 2008
Basic Weighting Approach • Suppose sample element i was selected with probability pi. Then sample element i represents (1 / pi ) elements in the population. • That is, count the element i in the analysis by giving it a weight of • wi = (1 / pi ). • For example, a sample element selected with probability 1/10 represents 10 elements in the population. CPES Training 2008
Overall Weight • Weighting may incorporate simultaneously all three components, unequal probabilities of selection, nonresponse, and poststratification: • Weight for unequal probabilities of selection: w1; • Weight for sample nonresponse: w2; • Poststratification weight for population noncoverage and sampling variance reduction: w3. Then compute the overall weight as: w = w1 x w2 x w3 • From Heeringa - ”Analysis of Complex Sample Survey Data” course, ISR SRC-Summer Institute CPES Training 2008
Bias Example • Use of final weights is important to obtain correct, unbiased prevalences, as an example I present a table that outlines the effects of not using weights for Mexico, one of the countries in the WMH Initiative CPES Training 2008
Analysis of the CPES • This section will focus on analysis of complex survey data, correct analysis of the CPES and provide a review of current software tools. CPES Training 2008
Analysis of Complex Sample Data • Data originates from sample designs that include features such as non-response adjustments, clustering, stratification, and differing probabilities of selection • CPES data is complex and variance estimation adjustments are required for proper analysis • Complex samples do not assume independence of observations, clustering and homogeneity are present • Assuming a Simple Random Sample (SRS) generally results in underestimation of variance estimates due to effective loss of sample size due to clustering within strata CPES Training 2008
Design Variables • Strata and Cluster variables are specified to represent the complex sample of the data, each data set has the appropriate design variables in the demographic dataset • From SAS documentation: • The STRATA statement names variables that form the strata in a stratified sample design. The combinations of categories of STRATA variables define the strata in the sample. The CLUSTER statement names variables that identify the clusters in a clustered sample design. The combinations of categories of CLUSTER variables define the clusters in the sample. If there is a STRATA statement, clusters are nested within strata CPES Training 2008
CPES Design Variables • Along with the CPES weights: • 2 key variables represent the complex sample design • SESTRAT • SECLUST • Understanding the distributions of the 2 variables in the CPES is very important and a first step is to examine distributions of the two variables CPES Training 2008
CPES Strata and Cluster Variables • An analysis of the SESTRAT * SECLUSTR shows there are a total of 180 stratum and values of 1 or 2 per cluster • Every case in the data set falls into 1 and only 1 of the SESTRAT*SECLUSTR cells, no missing data on these variables • This demonstration shows the full distribution of the SESTRAT / SECU variables CPES Training 2008
Software for Analysis of Complex Sample Data • Analysts should take the complex nature of the design into account by using one of the software packages that includes complex sample analysis routines • SAS survey procedures • Sudaan • Stata’s svy procedures • Complex Samples module of SPSS • Other options are IVEware, R, Wesvar, and Mplus CPES Training 2008
Common Statistical Techniques for Complex Sample Variance Estimation • The Taylor Series Linearization Approach is used by default in all SAS Survey Procs, Stata svy commands, SPSS CS routines, and in Sudaan (see SAS, Stata, SPSS, or Sudaan documentation for details on this technique) • Other methods include Repeated Replication Techniques such as Jackknife Repeated Replication and Balanced Repeated Replication, these will not be demonstrated during this training session but are included in the references and can also be performed in SAS (v9.2 +), Sudaan, and STATA plus additional software not covered today such as WesVar, R, IVEware • The next few slides show a grid of the major software with variance estimation methods, options included and analysis techniques available CPES Training 2008
Software for Survey Data Analysis CPES Training 2008
Descriptive Techniques CPES Training 2008
Regression Techniques CPES Training 2008
SAS v9.2 • SAS has full range of data management, analysis, graphing, reporting, complex design correction procedures and more • Complex design procs available in v9.2 • Proc surveymeans-means, univariates, ratios, totals, quantiles • Proc surveyfreq-frequency tables, 1 way and nway • Proc surveyreg-linear dependent variables,ANOVA • Proc surveylogistic-binary, ordinal, nominal logistic regression • Proc surveyselect-sampling procedure CPES Training 2008
SPSS v16 • SPSS is another very good option for data management and basic analysis that also includes survey data analysis commands in the “Complex Samples” module • Widely used around world, compatible with many users • Extensive online tutorials, very easy to use with either the point and click approach or by using commands • See SPSS documentation for command syntax and list of complex sample commands • Online demonstration of commands CPES Training 2008
STATA 10 • Stata offers full range of data management and analysis tools including many survey procedures for complex design corrections, offers varied options for complex design corrections • Most extensive and up-to-date software for survey data analysis • Not as widely used as SAS or SPSS at this point • See Stata documentation for complete list of svy procedures • Online demonstration CPES Training 2008
Sudaan v9.0 • Sudaan is another excellent tool for survey or complex sample data analysis • It offers many analytic techniques with a wide range of sample designs are accepted • Sudaan includes extensive hypothesis testing options appropriate for each analytic technique • Can perform a full range of variance estimation methods • See Sudaan documentation for list of procedures • Online demonstration of Sudaan procedures CPES Training 2008
Analysis Topics • This section focuses on special topics that arise during analysis • Hardware • Data transfer • Data preparation • Multiple imputations • Subpopulations CPES Training 2008
Considerations for Analysis of the CPES • What software and hardware tools are needed to carry out analysis? • Local machine • Remote server • SDA approach • What part of the CPES instruments do the variables of interest come from? • This will have an impact on weights used if part 2 NCSR variables • What weights should be used, full sample or subset? • Has something very similar already been published by someone else? Is this a realistic topic? CPES Training 2008
Data Transfer Software • DBMS Copy- allows easy and accurate movement of datafiles between all major packages such as SAS, SPSS, Excel, STATA • StatTransfer-another good tool for moving data between software packages • SAS built-in options- procs import and export, engine architecture allows reading of some types of external data sources, WIZARD enables point and click for data transfer • SPSS- produces SAS files as output in SPSS16 • Stata-some options to read in files from other programs • Sudaan-also includes options to read in data sets from other programs CPES Training 2008
Common Analysis Techniques • Data analysis usually consists of 80-90% preparation for analysis and actual analysis phase is about 10-20% of task • Of the 10-20% of analysis performed, about 80% of analysis would be covered by the following types of techniques: • Descriptive analysis • Means/Univariates • Frequency tables • Graphs • Survival Curves • Inferential analysis • Ordinary Least Squares • Logistic Regression with varying types of dependent variables (binary, ordinal, multinomial) • Survival analysis, mixed models/hierarchical models, Latent Class Analysis, and other more advanced methods represent a small portion of analyses CPES Training 2008
Standardized Approach to Analysis • Standardized approach to analysis work • If working with others, all team members use same software product, eliminates inefficiencies and confusion • Use coding rather than point and click, save programs for others to use, allows sharing of knowledge and programs • Replication of results can be achieved with organized setup and coding • Datasets stored in shared space and maintained by data manager • Shared computing resources, allows general sharing of programs and data, streamlined and less expensive licensing CPES Training 2008
Data Preparation • Preparing data for analysis: missing data issues and common techniques for imputation: means, medians within subgroups, regression based imputation • Recoding vars from 1 to 5 to 0/1, reversing scales, adding scales, arrays to process data iteratively, cleaning data by looking at outlier, wild codes, all missing right or wrong? • Variable construction, example of complex variable such as time varying education or suicide ideation and onset derived from multiple questions CPES Training 2008
Missing or Inconsistent Data • Check for structural missing versus missing due to refusal or don’t know by examining skip patterns and section flow • Examine key variables needed for analysis to identify problems to fix or impute • Examples are missing age of onset or age of recency along with disorder diagnosis • Logical inconsistencies such as age of onset of disorder is later than age of first treatment for same disorder • Check distributions for all variables needed for analysis to check for outliers or other problems prior to analysis phase CPES Training 2008
Missing Data • Simple imputation • Use of overall statistic for a common crossing of demographic variables such as age*gender*education group that person falls within: assign mean or median for crosstab group for imputation of personal income • Imputation based on other variables that might give clues that will help assign a realistic imputed value, for example, one approach is to use age of first treatment or age of last episode to do best guess of age of onset if that is missing • Etc. many other simple approaches • Check carefully for checkpoint problems or skip pattern inconsistency that might indicate data collection problem • Check actual interview or respondent comments from text file to see if any further information available • Multiple Imputation • Use regression based imputation tool such as IVEware or SAS Proc MI, MICE, SOLAS etc. to impute values CPES Training 2008
Multiply Imputed Data Sets • Most software packages can analyze multiply imputed data sets produced by the multiple imputation process • Analysis of multiple data sets along with complex sample corrections can be done at once thus including variability introduced from imputation and variance corrections for complex sample surveys CPES Training 2008
Subpopulation Analysis • Commonly done by most analysts interested in analysis within subpopulations such as gender/age groups etc. • Issues arise in how the subpopulations are handled by each software • Make sure to use the “domain” (SAS) or “subpopn” (Sudaan) or “subpop” (Stata) options when analyzing data from the CPES • Why? This will ensure that you are not deleting strata/secu combinations incorrectly and will utilize the full degrees of freedom for significance tests • Subsetting the data set rather than use of the subpopulation options often results in empty or singleton strata/secu cells and a loss of the original complex sample design representation CPES Training 2008
Subpopulation Analysis in SAS • From SAS Documentation v9.2: • The DOMAIN statement of SAS requests analysis for subpopulations, or domains, in addition to analysis for the entire study population. The DOMAIN statement names the variables that identify domains, which are called domain variables. • It is common practice to compute statistics for domains. The formation of these domains may be unrelated to the sample design. Therefore, the sample sizes for the domains are random variables. In order to incorporate this variability into the variance estimation, you should use a DOMAIN statement. • Note that a DOMAIN statement is different from a BY statement. In a BY statement, you treat the sample sizes as fixed in each subpopulation, and you perform analysis within each BY group independently (from SAS v9.2 documentation) CPES Training 2008
Sudaan/SPSS/Stata Subpopulation Analysis • Sudaan software offers domain type analysis for every procedure via the “subpopn” statement • Use of a “subpopn” statement will allow Sudaan to subset the data for analysis but include all design information in the analysis, similar to the domain analysis in SAS • Results from Sudaan with a subpopn statement will use the full degrees of freedom for the entire sample even though the actual analysis may not use all records, why? Because those people theoretically could exist in each cell of the strata*secu grid but don’t happen to be in this particular sample • Stata 10 also offers a subpopulation analysis for each of the “svy” procedures (subpop), see the Stata documentation for help • SPSS includes an optional subpopulation feature for every command CPES Training 2008
Summary of Analysis of Complex Survey Data • CPES data is complex due to each survey including stratification, clustering and sampling techniques which are simple random samples • Special techniques should be used to incorporate these features of the designs • SAS, Stata, SPSS, and Sudaan each offer very good complex sample survey data analysis features to account for the complex sample design • CPES users should make full use of the weights, strata, and cluster/SECU variables when analyzing the data set CPES Training 2008
Survival Analysis with CPES • This section focuses on using survival techniques for analysis of the CPES data set CPES Training 2008
Key Elements for Survival Analysis • Timing of events is studied in event history analysis, analysis of timing of when and if events occur • Predictors can be either time-varying (marital status, education) or time-invariant (race) • Censoring is another important concept for event history analysis, censoring occurs when follow-up of individual ends and we can no longer determine whether or not event of interest occurs, such cases that do not yet have the outcome of interest are called censored • Right censoring occurs naturally in our surveys, censored at time of interview CPES Training 2008