Download
1 / 1
10 likes | 55 Views
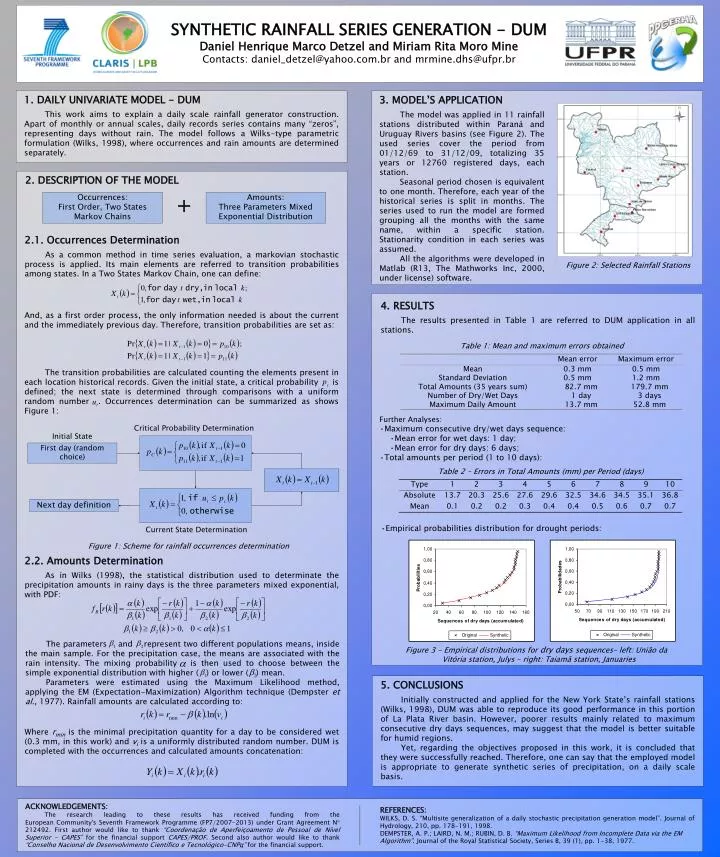
SYNTHETIC RAINFALL SERIES GENERATION - DUM Daniel Henrique Marco Detzel and Miriam Rita Moro Mine Contacts: daniel_detzel@yahoo.com.br and mrmine.dhs@ufpr.br. 1. DAILY UNIVARIATE MODEL - DUM

E N D
SYNTHETIC RAINFALL SERIES GENERATION - DUM Daniel Henrique Marco Detzel and Miriam Rita Moro Mine Contacts: daniel_detzel@yahoo.com.br and mrmine.dhs@ufpr.br 1. DAILY UNIVARIATE MODEL - DUM This work aims to explain a daily scale rainfall generator construction. Apart of monthly or annual scales, daily records series contains many “zeros”, representing days without rain. The model follows a Wilks-type parametric formulation (Wilks, 1998), where occurrences and rain amounts are determined separately. 3. MODEL’S APPLICATION The model was applied in 11 rainfall stations distributed within Paraná and Uruguay Rivers basins (see Figure 2). The used series cover the period from 01/12/69 to 31/12/09, totalizing 35 years or 12760 registered days, each station. Seasonal period chosen is equivalent to one month. Therefore, each year of the historical series is split in months. The series used to run the model are formed grouping all the months with the same name, within a specific station. Stationarity condition in each series was assumed. All the algorithms were developed in Matlab (R13, The Mathworks Inc, 2000, under license) software. 2. DESCRIPTION OF THE MODEL Occurrences: First Order, Two States Markov Chains Amounts: Three Parameters Mixed Exponential Distribution + 2.1. Occurrences Determination As a common method in time series evaluation, a markovian stochastic process is applied. Its main elements are referred to transition probabilities among states. In a Two States Markov Chain, one can define: Figure 2: Selected Rainfall Stations 4. RESULTS The results presented in Table 1 are referred to DUM application in all stations. And, as a first order process, the only information needed is about the current and the immediately previous day. Therefore, transition probabilities are set as: Table 1: Mean and maximum errors obtained The transition probabilities are calculated counting the elements present in each location historical records. Given the initial state, a critical probability is defined; the next state is determined through comparisons with a uniform random number . Occurrences determination can be summarized as shows Figure 1: • Further Analyses: • Maximum consecutive dry/wet days sequence: • Mean error for wet days: 1 day; • Mean error for dry days: 6 days; • Total amounts per period (1 to 10 days): Critical Probability Determination Initial State First day (random choice) Table 2 – Errors in Total Amounts (mm) per Period (days) Next day definition • Empirical probabilities distribution for drought periods: Current State Determination Figure 1: Scheme for rainfall occurrences determination 2.2. Amounts Determination As in Wilks (1998), the statistical distribution used to determinate the precipitation amounts in rainy days is the three parameters mixed exponential, with PDF: The parameters and represent two different populations means, inside the main sample. For the precipitation case, the means are associated with the rain intensity. The mixing probability is then used to choose between the simple exponential distribution with higher ( ) or lower ( ) mean. Parameters were estimated using the Maximum Likelihood method, applying the EM (Expectation-Maximization) Algorithm technique (Dempster et al., 1977). Rainfall amounts are calculated according to: Figure 3 – Empirical distributions for dry dayssequences– left: União da Vitória station, Julys – right: Taiamã station, Januaries 5. CONCLUSIONS Initially constructed and applied for the New York State’s rainfall stations (Wilks, 1998), DUM was able to reproduce its good performance in this portion of La Plata River basin. However, poorer results mainly related to maximum consecutive dry days sequences, may suggest that the model is better suitable for humid regions. Yet, regarding the objectives proposed in this work, it is concluded that they were successfully reached. Therefore, one can say that the employed model is appropriate to generate synthetic series of precipitation, on a daily scale basis. Where rmin is the minimal precipitation quantity for a day to be considered wet (0.3 mm, in this work) and vi is a uniformly distributed random number. DUM is completed with the occurrences and calculated amounts concatenation: ACKNOWLEDGEMENTS: The research leading to these results has received funding from theEuropean Community's Seventh Framework Programme (FP7/2007-2013) under Grant Agreement N° 212492. First author would like to thank “Coordenação de Aperfeiçoamento de Pessoal de Nível Superior – CAPES” for the financial support CAPES/PROF. Second also author would like to thank “Conselho Nacional de Desenvolvimento Científico e Tecnológico-CNPq” for the financial support. REFERENCES: WILKS, D. S. “Multisite generalization of a daily stochastic precipitation generation model”. Journal of Hydrology, 210, pp. 178-191, 1998. DEMPSTER, A. P.; LAIRD, N. M.; RUBIN, D. B. “Maximum Likelihood from Incomplete Data via the EM Algorithm”. Journal of the Royal Statistical Society, Series B, 39 (1), pp. 1-38, 1977.