Download
1 / 49
520 likes | 865 Views
Introduction to Scientific Visualization. Erik Brisson ebrisson@bu.edu. Topics. Introduction Scientific data domains Visualization techniques Software packages and workflow Conclusion. What is sci-vis?. Could mean many things (e.g., plotting, illustration)

E N D
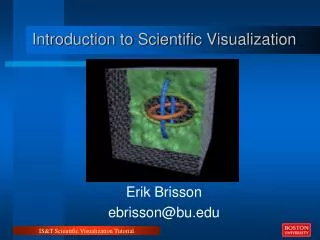
Introduction to Scientific Visualization Erik Brisson ebrisson@bu.edu IS&T Scientific Visualization Tutorial
Topics • Introduction • Scientific data domains • Visualization techniques • Software packages and workflow • Conclusion IS&T Scientific Visualization Tutorial
What is sci-vis? Could mean many things (e.g., plotting, illustration) Combination of 3-D graphics technology and human perception of objects in space IS&T Scientific Visualization Tutorial
The Visualization Pipeline Math Proc Scientific visualization Computer Graphics 191 214 206 113 134 135 101 120 135 102 119 147 113 129 165 117 131 170 125 138 170 158 168 195 219 227 246 244 251 255 249 254 255 197 202 222 157 163 187 156 161 190 165 172 200 218 224 246 250 255 255 252 255 251 251 255 252 245 249 250 251 255 255 188 192 204 196 200 212 234 238 250 177 181 192 111 114 133 122 121 155 154 151 194 182 176 220 243 240 255 253 252 255 250 251 246 254 254 252 255 255 255 255 255 255 254 254 254 255 255 255 255 255 255 254 254 254 255 255 255 249 249 249 249 249 249 252 252 252 255 221 155 255 255 255 255 255 255 255 255 255 255 255 255 255 255 255 255 255 255 255 255 255 255 255 255 255 255 255 253 253 253 252 252 252 252 252 252 253 253 253 255 255 255 255 255 255 255 255 255 IS&T Scientific Visualization Tutorial
The Visualization Pipeline - Hardware Field instruments Scientists/programmers Supercomputers Graphics machines Publications, movies/DVDs, web Demos, educational software IS&T Scientific Visualization Tutorial
The Visualization Pipeline - Software Data acquisition and preparation Sci-vis tools Geometric Representation Rendering Post-processing IS&T Scientific Visualization Tutorial
Many possible workflows Data Matlab VTK OSG Maya IDL Paraview Performer OpenGL Gnuplot DAFFIE Display Wall Xmgrace Web Excel Photoshop Premier IS&T Scientific Visualization Tutorial
Scientific data domains IS&T Scientific Visualization Tutorial
Regular grid IS&T Scientific Visualization Tutorial
Perimeter grid IS&T Scientific Visualization Tutorial
Generalized grid IS&T Scientific Visualization Tutorial
General mesh IS&T Scientific Visualization Tutorial
Sample data at discrete points IS&T Scientific Visualization Tutorial
Interpolating domain - triangulation IS&T Scientific Visualization Tutorial
Interpolating domain – general polygons IS&T Scientific Visualization Tutorial
Scalar data in 3D: As points IS&T Scientific Visualization Tutorial
Scalar data: Cutplanes IS&T Scientific Visualization Tutorial
Scalar data: Regions of Interest IS&T Scientific Visualization Tutorial
Scalar data: Isosurface w/ROI IS&T Scientific Visualization Tutorial
Transparent isosurface w/cutplanes IS&T Scientific Visualization Tutorial
Colored isosurface w/cutplanes IS&T Scientific Visualization Tutorial
Colored transpisosurface w/cutplanes IS&T Scientific Visualization Tutorial
Multi isosurfaces w/cutplanes IS&T Scientific Visualization Tutorial
Technique: Mapping onto isosurface IS&T Scientific Visualization Tutorial
Technique: Volume Visualization IS&T Scientific Visualization Tutorial
Vector data in 3D: Vector glyphs IS&T Scientific Visualization Tutorial
Technique: Vector field streaklines IS&T Scientific Visualization Tutorial
Technique: Vector field ribbons IS&T Scientific Visualization Tutorial
Visualization Packages • Matlab for visualization • IDL • VTK • Paraview • OpenGL • OpenSceneGraph • Maya • DAFFIE and the display wall IS&T Scientific Visualization Tutorial
MATLAB and IDL • General purpose numeric packages • Data analysis, simulation, mathematics • Include plotting and graphics • Command line / scripting • Commercial software (no source available) • Widely used and well supported • Available on SCF machines IS&T Scientific Visualization Tutorial
VTK and ParaView • Scientific visualization packages • Open source • Widely used • Available on SCF machines • VTK is a library, many language bindings • Paraview GUI based, built on VTK IS&T Scientific Visualization Tutorial
OpenGL • Widely supported at hardware level • Access to all graphics card features • Program from scratch • Only option for some large applications IS&T Scientific Visualization Tutorial
OpenGL – primitives IS&T Scientific Visualization Tutorial
OpenSceneGraph • Program using scene graph paradigm • Lots of utility functions • Open source • OpenGL based • Similar to SGI Performer • Many utility functions • Notably, 3-D file readers IS&T Scientific Visualization Tutorial
OpenSceneGraph IS&T Scientific Visualization Tutorial
Maya screenshot IS&T Scientific Visualization Tutorial
Maya screenshot IS&T Scientific Visualization Tutorial
The BU DVD Wall • 24 projectors • 24 Linux machines • Passive stereo • One “head node” • Localized sound • Wireless navigation IS&T Scientific Visualization Tutorial
Your Project Describe your work in visual / geometric way? What is goal, e.g., web, publication, presentation? What is the time line? How much learning time can you invest? How much do you expect to use? IS&T Scientific Visualization Tutorial
Many possible workflows Data Matlab VTK OpenGL Maya IDL Paraview OSG Photoshop Gnuplot DAFFIE Performer Premier Xmgrace Excel IS&T Scientific Visualization Tutorial
Example workflow – molecular dynamics • Simulation creates data files • Molecule x,y,z + type • colored spheres (C program) • Electron density as volume data • isosurfaces (IDL) .obj files • Rendered in Maya IS&T Scientific Visualization Tutorial
Example workflow –pressure on turbine • Simulation run on supercomputer • Producedmany Plot3d files • C code transforms data to .obj files • Rendered in Maya • Processed using Imagemagick for DVD Wall movies IS&T Scientific Visualization Tutorial
Example workflow –showing entropy • Isosurfaces in IDL • Convert output into .obj • Render in Maya, with transparency • View in 3D on Wall IS&T Scientific Visualization Tutorial
Example workflow –stretched water • Given positions of atoms in water • How to show “holes”? • Construct volume data of distance • Use volume visualization IS&T Scientific Visualization Tutorial
Example workflow –CISM • Researchers used OpenDX • SCV staff modified OpenDX networks • Produced wall movies and demos IS&T Scientific Visualization Tutorial
Example workflow –Corporate Connections • Researchers provided data • SCV staff wrote custom viewing code IS&T Scientific Visualization Tutorial
Artworld “family portrait” IS&T Scientific Visualization Tutorial
Visualization Tutorials Introduction to Scientific Visualization Scientific Visualization Using ParaView Scientific Visualization Using VTK Scientific Visualization Using MATLAB Graphics Programming in C/C++: OpenGL and OpenSceneGraph Introduction to Maya [CAS 327] Graphics and Images for Publication and Presentation IS&T Scientific Visualization Tutorial
Conclusion • Contact me: Erik Brisson – ebrisson@bu.edu • Tutorial presentations and examples online: www.bu.edu/tech/research/training/presentations/list/ IS&T Scientific Visualization Tutorial