Download
1 / 8
130 likes | 435 Views
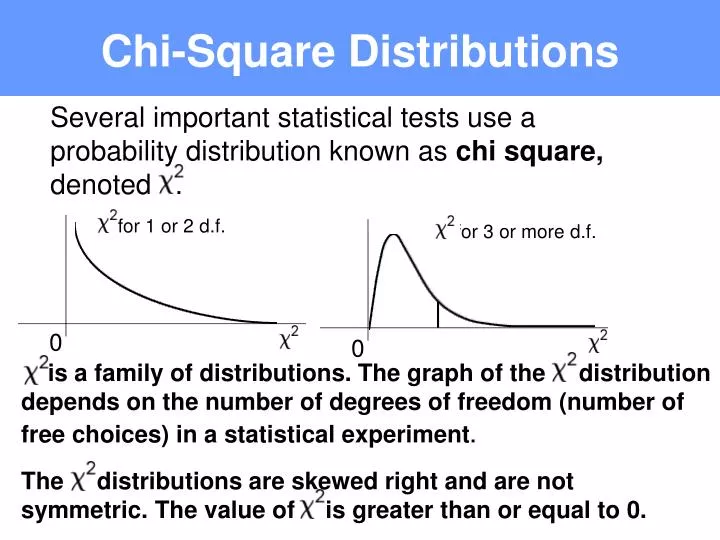
Chi-Square Distributions. Several important statistical tests use a probability distribution known as chi square, denoted . for 1 or 2 d.f. for 3 or more d.f. 0. 0.

E N D
Chi-Square Distributions Several important statistical tests use a probability distribution known as chi square, denoted . for 1 or 2 d.f. for 3 or more d.f. 0 0 is a family of distributions. The graph of the distribution depends on the number of degrees of freedom (number of free choices) in a statistical experiment. • The distributions are skewed right and are not symmetric. The value of is greater than or equal to 0.
Multinomial Experiments A multinomial experiment is a probability experiment in which there are a fixed number of independent trials and there are more than two possible outcomes for each trial. • The probability for each outcome is fixed. • The sum of the probabilities of all possible outcomes is one. A chi-square goodness-of-fit test is used to test whether a frequency distribution fits a specific distribution.
Chi-Square Test for Goodness-of-Fit First Marriage % Bride and Groom 50 Bride only 12 Groom only 14 24 Neither Example: A social service organization claims 50% of all marriages are the first marriage for both bride and groom, 12% are first for the bride only, 14% for the groom only and 24% a remarriage for both. H0: The distribution of first-time marriages is 50% for both bride and groom, 12% for the bride only, 14% for the groom only. 24% are remarriages for both. H1: The distribution of first-time marriages differs from the claimed distribution.
Goodness-of-Fit Test First Marriage % Bride and Groom 50 Bride only 12 Groom only 14 Neither 24 Observed frequency, O, is the frequency of the category found in the sample. Expected frequency, E, is the calculated frequency for the category using the specified distribution. Ei = npi In a survey of 103 married couples, find the E = expected number in each category. E = np 103(.50) = 51.50 103(.12) = 12.36 103(.14) = 14.42 103(.24) = 24.72
Chi-Square Test If the observed frequencies are obtained from a random sample and each expected frequency is at least 5, the sampling distribution for the goodness-of-fit test is a chi-square distribution with k – 1 degrees of freedom (where k = the number of categories). The test statistic is: O = observed frequency in each category E = expected frequency in each category
A social service organization claims 50% of all marriages are the first marriage for both bride and groom, 12% are first for the bride only, 14% for the groom only, and 24% a remarriage for both. The results of a study of 103 randomly selected married couples are listed in the table. Test the distribution claimed by the agency. First Marriage f 55 Bride and Groom Bride only 12 Groom only 12 Neither 24 Use . 1. Write the null and alternative hypothesis. H0: The distribution of first-time marriages is 50% for both bride and groom, 12% for the bride only, 14% for the groom only. 24% are remarriages for both. Ha: The distribution of first-time marriages differs from the claimed distribution. 2. State the level of significance.
% O E (O – E) 2/E 51.5_ 0.2379 Bride and groom 50 55 12 12.36 12 0.0105 Bride only Groom only 14 12 14.42 0.4061 Neither 24.72 0.0210 24 24 103.__ 0.6755 Total 100 103 3. Determine the sampling distribution. A chi-square distribution with 4 – 1 = 3 d.f. 4. Find the critical value. 5. Find the rejection region. 2 11.34 0 6. Find the test statistic. (O – E)2 12.25__ 0.1296 5.8564 0.5184 = 0.6755
11.34 0 7. Make your decision. The test statistic 0.6755 does not fall in the rejection region, so fail to reject H0. 8. Interpret your decision. The distribution fits the specified distribution for first-time marriages.