Download

1 / 16
160 likes | 534 Views
Chi-square and F Distributions. Children of the Normal. Distributions. There are many theoretical distributions, both continuous and discrete. We use 4 of these a lot: z (unit normal), t, chi-square, and F.

E N D
Chi-square and F Distributions Children of the Normal
Distributions • There are many theoretical distributions, both continuous and discrete. • We use 4 of these a lot: z (unit normal), t, chi-square, and F. • Z and t are closely related to the sampling distribution of means; chi-square and F are closely related to the sampling distribution of variances.
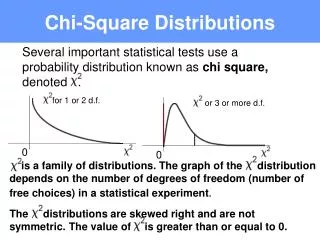
Chi-square Distribution (1) z score z score squared Make it Greek What would its sampling distribution look like? Minimum value is zero. Maximum value is infinite. Most values are between zero and 1; most around zero.
Chi-square (2) What if we took 2 values of z2 at random and added them? Same minimum and maximum as before, but now average should be a bit bigger. Chi-square is the distribution of a sum of squares. Each squared deviation is taken from the unit normal: N(0,1). The shape of the chi-square distribution depends on the number of squared deviates that are added together.
Chi-square 3 The distribution of chi-square depends on 1 parameter, its degrees of freedom (df or v). As df gets large, curve is less skewed, more normal.
Chi-square (4) • The expected value of chi-square is df. • The mean of the chi-square distribution is its degrees of freedom. • The expected variance of the distribution is 2df. • If the variance is 2df, the standard deviation must be sqrt(2df). • There are tables of chi-square so you can find 5 or 1 percent of the distribution. • Chi-square is additive.
Distribution of Sample Variance Sample estimate of population variance (unbiased). Multiply variance estimate by N-1 to get sum of squares. Divide by population variance to normalize. Result is a random variable distributed as chi-square with (N-1) df. We can use info about the sampling distribution of the variance estimate to find confidence intervals and conduct statistical tests.
Testing Exact Hypotheses about a Variance Test the null that the population variance has some specific value. Pick alpha and rejection region. Then: Plug hypothesized population variance and sample variance into equation along with sample size we used to estimate variance. Compare to chi-square distribution.
Example of Exact Test Test about variance of height of people in inches. Grab 30 people at random and measure height. Note: 1 tailed test on small side. Set alpha=.01. Mean is 29, so it’s on the small side. But for Q=.99, the value of chi-square is 14.257. Cannot reject null. Note: 2 tailed with alpha=.01. Now chi-square with v=29 and Q=.995 is 13.121 and also with Q=.005 the result is 52.336. N. S. either way.
Confidence Intervals for the Variance We use to estimate . It can be shown that: Suppose N=15 and is 10. Then df=14 and for Q=.025 the value is 26.12. For Q=.975 the value is 5.63.
Normality Assumption • We assume normal distributions to figure sampling distributions and thus p levels. • Violations of normality have minor implications for testing means, especially as N gets large. • Violations of normality are more serious for testing variances. Look at your data before conducting this test. Can test for normality.
The F Distribution (1) • The F distribution is the ratio of two variance estimates: • Also the ratio of two chi-squares, each divided by its degrees of freedom: In our applications, v2 will be larger than v1 and v2 will be larger than 2. In such a case, the mean of the F distribution (expected value) is v2 /(v2 -2).
F Distribution (2) • F depends on two parameters: v1 and v2 (df1 and df2). The shape of F changes with these. Range is 0 to infinity. Shaped a bit like chi-square. • F tables show critical values for df in the numerator and df in the denominator. • F tables are 1-tailed; can figure 2-tailed if you need to (but you usually don’t).
Testing Hypotheses about 2 Variances • Suppose • Note 1-tailed. • We find • Then df1=df2 = 15, and Going to the F table with 15 and 15 df, we find that for alpha = .05 (1-tailed), the critical value is 2.40. Therefore the result is significant.
A Look Ahead • The F distribution is used in many statistical tests • Test for equality of variances. • Tests for differences in means in ANOVA. • Tests for regression models (slopes relating one continuous variable to another like SAT and GPA).
Relations among Distributions – the Children of the Normal • Chi-square is drawn from the normal. N(0,1) deviates squared and summed. • F is the ratio of two chi-squares, each divided by its df. A chi-square divided by its df is a variance estimate, that is, a sum of squares divided by degrees of freedom. • F = t2. If you square t, you get an F with 1 df in the numerator.