Download
1 / 32
330 likes | 358 Views
Dive deep into Earth science with a focus on geosphere, hydrosphere, atmosphere, and biosphere. Understand the interactions among these spheres, technology applications, and the scientific method steps for study and exploration.

E N D
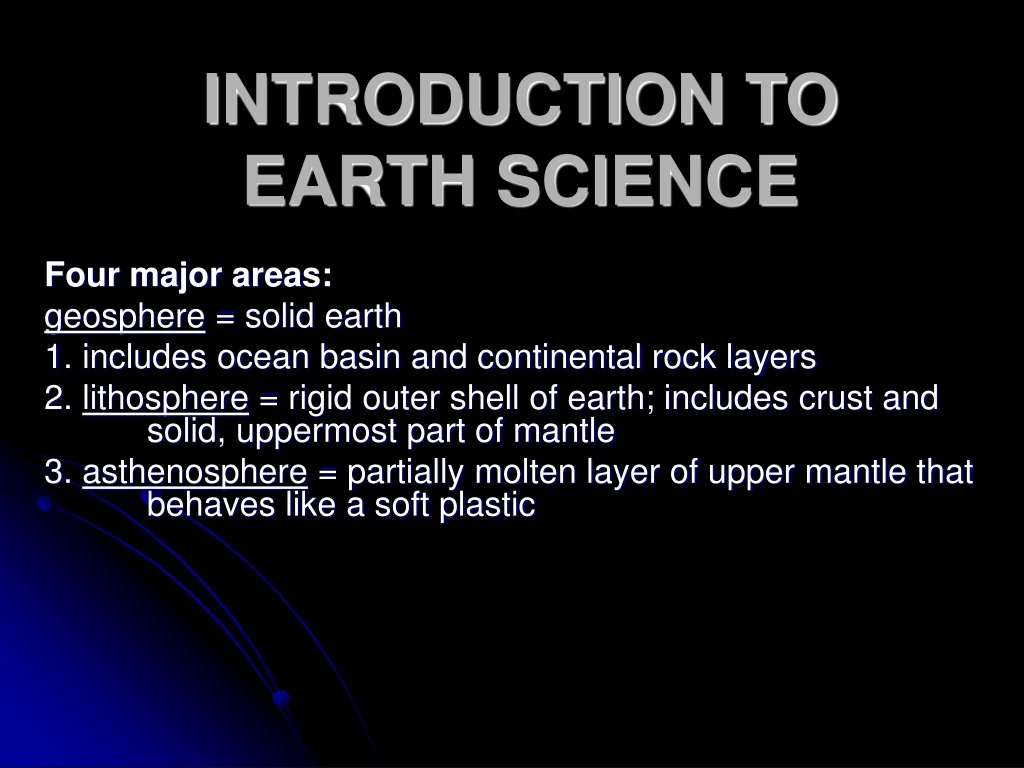
INTRODUCTION TO EARTH SCIENCE Four major areas: geosphere = solid earth 1. includes ocean basin and continental rock layers 2. lithosphere = rigid outer shell of earth; includes crust and solid, uppermost part of mantle 3. asthenosphere = partially molten layer of upper mantle that behaves like a soft plastic
hydrosphere = contains all the water at or near Earth’s surface 1. includes oceans, lakes, rivers, & groundwater; also includes ice & snow on mountains & in glaciers 2. 97% of water exists as salt water; 3% fresh water 3. about ¾ of all freshwater is in glaciers and icebergs 4. only about half of 1% is usable fresh water 5. continuously recycled
atmosphere = blanket of gases surrounding earth 1. 78% nitrogen, 21% oxygen, remaining 1% is various gases 2. necessary for respiration for most living organisms, protects organisms from harmful radiation from Sun, help keep planet temperature suitable for life 3. unique in solar system due to only one to contain free oxygen 4. changes amounts of water vapor result in areas of high or low humidity
biosphere = includes all life on earth and physical environment that supports it 1. largest ecosystem 2. extends from ocean depths to atmosphere a few kilometers above earth’s surface Interaction among spheres: 1. all four are constantly moving, changing, and interacting 2. can be a single event, temporary change, or ongoing, steady process 3. humans are altering since industrial revolution 4. changes in one sphere have profound effects on one or more of the other spheres
earth science = study of earth and the universe around it Four Branches: 1. geology = study of origin, history, and structure of solid earth and processes that shape it 2. oceanography = study of earth’s oceans 3. meteorology = study of earth’s atmosphere 4. astronomy = study of universe beyond earth Subspeciality areas: 1. climatology = patterns of weather over a long period of time; how human activities effect weather and climate 2. paleontology = study of remains of organisms that once lived on Earth; ancient environments 3. hydrology = study of water flow on and below Earth’s surface; sources of and solutions to water pollution
4. ecology = study of complex relationships between living things and their environment a. ecosystem = community of organisms and the environment they inhabit 1) each physically distinct and self-supporting b. each delicately balanced 1) pollution = contamination of environment with waste products or impurities 2) biodegradable = products can be broken down by microorganisms into harmless substances 3) nonbiodegradable = products cannot be broken down Ex: plastic
5. geochemistry = study of earth’s composition and the processes that change it 6. tectonics = study of the effects of internal processes on Earth’s surface technology = application of scientific discoveries 1. is transferable . can be applied to new situations
scientific method = useful tools for the study of earth science 1. organized, logical approaches to scientific research 2. guides to scientific problem solving STEPS: 1. state the problem: What do you want to find out? a. observations = using the senses (sight, touch, taste, hearing, smell) to gather information about the world 1) often begins scientific inquiry 2) often leads to questioning b. develop clear statement defining problem
2. gather information a. measurement = comparison of some aspect of an object or phenomena with a standard unit 1) unit of measure Ex: km 2) number stating how many units are present Ex: 5 b. accuracy important c. inference = suggest a possible explanation for an observation Ex: The dog is barking because someone is outside. 3. form a hypothesis: What prediction do you want to test? a. hypothesis = possible explanation or solution to problem b. based on facts gathered through observation c. not accepted by scientific community unless there is evidence to support it
4. test hypothesis a. experimentation 1) experiment = scientific procedure carried out according to certain guidelines 2) variable = factor in experiment that can be changed; *should only test 1 at a time a) dependent variable = factor that changes if the independent variable is changed b) independent variable = factor that is manipulated by the experimenter 3) controlled experiment = set up to test only one variable 4) run a control = standard for comparison a) same conditions as experiment except variable b) ensures only one variable is tested
5) collect data = recorded observations and measurements a) analyze results b) construct graphs, charts, etc. to visually compare when possible c) include both types of observations 1] qualitative observations = describe a property without measurements 2] quantitative observations = property is measured & described by a number of standard units b. if experimentation is not possible 1) make more observations to gather evidence that will support or discredit hypothesis 2) hypothesis tested by examining how well it fits or explains all known observations
5. analyze the results: What happened during your experiment? a. look for patterns or trends b. organize data in charts, tables, or graphs when possible 6. state conclusion a. correctness of hypothesis → determined by how well it fits known facts b. hypothesis may be accepted as stated, altered slightly, or discarded altogether
International System of Units (SI) = based on a decimal system which uses the number 10 and multiplies of 10 length = distance between two points 1. measured with a metric ruler, meterstick, or a measuring tape 2. meter (m) = standard unit
mass = amount of matter in an object 1. measured using a balance 2. kilogram = standard unit 3. gram or milligram used with smaller objects weight = measure of the strength of the pull of gravity on an object 1. measure with a spring scale 2. Newton (N) = standard unit
area = amount of surface included within a set of boundaries A = l X w (length X width) 7.3 m X 3.6 m = 26.28 = 26.3 m2
volume = how much space an object occupies 1. standard unit is cubic meter (m3) 2. liquid volumes = liters (L) and milliliters (mL) 3. solid volumes = cubic centimeters (cm3 or cc) 4. liquid volumes are measured with a graduated cylinder or beaker 5. conversion factor: 1mL = 1cm3 6. if not given determine by: (solids) V = l X w X h (length X width X height)
density = measure of the amount of matter that occupies a particular space density = mass D = m volume V 1. depends on the kinds of atoms it contains and how closely packed 2. expressed as g/cm3 or g/mL 3. if object denser than water → sink; if object less dense than water → float time = span between two events SI unit = second
temperature = how hot or cold something is; measured with a thermometer 1. SI unit = Kelvin (K) 2. absolute zero = coldest temperature [0K] 3. most scientist use the Celsius scale 4. conversions from one scale to another Conversion formulas: oF = (1.8 X oC) + 32 oC = K - 273 oC =.55 X (oF - 32) K = oC + 273
scientific notation = expresses quantity as a number multiplied by 10 to the appropriate power 1. numbers written in M X 10n form [M = number > or = to 1 but < 10; n = whole number] 2. Determine M by moving decimal point in original number to left or right so that only one nonzero digit remains to the left of decimal point. 3. Determine n by counting number of places that you moved decimal point. If you moved it to the left, n is positive. If you moved it to the right, n is negative. Ex: 10000 = 1 X 10⁴ 0.0000065 = 6.5 X 10⁻⁶
4. addition and subtraction: a. values must have same exponent (n) b. once exponents are the same, M factors are added or subtracted c. be sure answer only has one digit left of decimal 5. multiplication: a. M factors are multiplied b. exponents are added Ex: (2.5 X 10²) (3.6 X10⁵) = 9.0 X 10⁷ 6. division: a. M factors are divided b. exponent of denominator (bottom) is subtracted from numerator (top) Ex: 7.9 X 1014 = 2.3 X10⁹ 3.5 X 10⁵
significant figures = all digits known with certainty plus one final digit, which is uncertain or estimated 1. precision of measurement is indicated by the number of significant digits 2. all numbers 1 to 9 are significant 3. rules: a. Zeros appearing between nonzero digits are significant. Ex: 5.007 m 4 significant digits b. Zeros appearing in front of nonzero digits are not significant. Ex: 0.0594 3 significant digits
c. Zeros at the end of a number and to the right of a decimal are significant. Ex: 20.00 4 significant digits 0.0380 3 significant digits d. Zeros at the end of a number but to the left of a decimal may or may not be significant. Ex: 4300 g may have 2 to 4 significant digits depending on how many are place holders. -for our measurements we will assume that 4300 g has only 2 significant digits If a decimal is placed after the zeros this indicates the zeros are significant. Ex: 4300. g 4 significant digits
4. rounding off: a. If last number is equal to 5 or greater than 5 then round up to the next number. Ex: Round 7.89 to 2 significant digits 7.89 = 7.9 b. If last number is less than 5 then leave the number unchanged and drop the last number. Ex: Round each to 2 significant digits. 0.133 = 0.13 6.93 = 6.9 5. addition or subtraction: answer must have same number of digits to right of decimal point as there are in measurement having fewest digits to the right of decimal point 6. multiplication and division: answer can have no more significant digits than are in measurement with fewest number of significant digits
accuracy = how close your value is to the accepted value depends on: 1. ability to compare object being measured to standard 2. precision of measuring instrument precision = closeness of set of measurements of same quantity made in the same way 1. measured values are close to one another but not necessarily close to accepted value 2. exactness of a measurement
percent error = accuracy of value or of an average experimental value compared quantitatively with correct or accepted value percent error = Value accepted – value experimental X 100 Value accepted
graphs = show a comparison between variables line graph = shows trends or how data changes over time 1. independent variable is plotted on the horizontal x-axis 2. dependent variable is plotted on the vertical y-axis 3. scale size can vary; smaller scales show better graphs, more detail 4. plot data points where points from x-axis and y-axis meets 5. after all points are plotted, connect them with a smooth line 6. must be drawn on graph paper
bar graph = compares information for several items or events 1. thick bars are used to show relationship among data 2. x-axis and y-axis must be set up on a scale; must be on graph paper 3. data is plotted by drawing thick bars from point where x-axis and y-axis meet down to x-axis line 4. space should be left between bars when possible 5. identify x-axis and y-axis to indicate type of data being presented 6. bars should be shaded with different colors
pie graph = shows how a fixed quantity is broken down into parts 1. circle represents total amount present 2. slices represent the parts which are shown as percentages of the total 3. circle and slices should be labeled to identify the specific data 4. find out how much of the circle each section or part will take a. take each part and divide by the total b. multiply answer by 360 (number of degrees in a circle) part X 360 = number of degrees (mark circle) total 5. plot groups and label sections with percents and not degrees To find percent: part X 100 = #% (label section) total
model = representation of an actual object or an idea of how an object looks 1. scale = fixed ratio between the size of the model and the size of the real object Ex: model river is 3 meters deep actual river is 30 meters deep ratio is 3:30 or 1:10 2. two types of models a. physical models = represent actual objects Ex: maps, globes, etc. b. mental models = ideas of how objects look Ex: model of an atom
theory = explanation based on many observations during repeated experiments 1. valid only if it is consistent with observations, makes predictions that can be tested, and is simplest explanation of observations 2. explain why things happen the way they do 3. can be changed or modified with discovery of new data
scientific law = rule that correctly describes a natural phenomenon “rule of nature” 1. theory must be proven correct every time it is tested 2. events described by a law are observed to be the same every time, but does not explain why 3. may change; often explained by theories
Methods of Research 1. field study = carried out in a natural setting a. visit an area to observe effects of an event 1) gather samples 2) draw maps 3) take photographs 4) describe study area in detail b. organize information as accurate comparisons of changes over time can be made 2. laboratory experimentation a. use information and samples from field study b. conduct experiments to isolate small aspect of a larger event c. able to more accurately explain relationships among variables that are involved in event