Download

1 / 49
490 likes | 521 Views
Explore the fundamental concepts of Earth science, including major spheres, scientific inquiry, hypothesis, theory, and the scientific method. Understand how Earth scientists seek knowledge and interpret data.

E N D
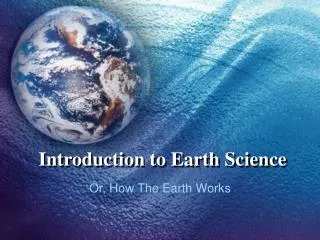
Introduction to Earth Science Chapter 1
Essential Questions • What does an Earth Scientist study? • What information do various maps give to an Earth Scientist? • How do Earth Scientists (and all scientists) seek knowledge?
Overview of Earth Science • Earth science is the name of the group of sciences that deals with Earth and its neighbors in space. • Earth science is divided into four broad categories:
The Earth Sciences • Geology—the study of the solid Earth • Oceanography—the study of the Earth’s oceans • Meteorology—the study of the Earth’s atmosphere • Astronomy—the study of the Earth’s place in the universe • Environmental Science – the study of how an organism interacts with its environment
A View of the Earth • Earth can be thought of as consisting of four major spheres: • Hydrosphere • Atmosphere • Geosphere • Biosphere
Earth’s Major Spheres • The hydrosphere includes all liquid water on Earth—both saltwater and fresh water. • The atmosphere consists of the gaseous envelope surrounding the Earth. • Although the atmosphere extends more than 100km up, 90% is within 16km of the surface.
Earth’s Major Spheres • The biosphere includes all life on Earth. • The biosphere is concentrated in a zone that extends from the ocean floor upward several kilometers in the atmosphere. • The geosphere consists of the solid parts of the planet and is not uniform. • Based on differences in composition it is divided into three main regions, the core, the mantle, and the crust.
Scientific Inquiry • All science is based on two big assumptions: • The universe behaves in a consistent and predictable manner. • Through study, we can understand this behavior.
Hypothesis • Once observations have been made and data gathered, scientists try to explain how or why things happen in the manner observed. • They state a possible explanation called a scientific hypothesis.
Theory • Once further observations have been made and/or tests performed, scientists either accept, modify, or reject their hypothesis. • The hypothesis is elevated to a Scientific Theory once it has been well tested and accepted by the scientific community as the best explanation of observable facts.
Scientific Method Problem/Question Observation/Research Formulate a Hypothesis Experiment Collect and Analyze Results Conclusion Communicate the Results
Steps of the Scientific Method 1. Problem/Question: Develop a question or problem that can be solved through experimentation.
Steps of the Scientific Method 2. Observation/Research: Make observations and research your topic of interest.
Steps of the Scientific Method 3. Formulate a Hypothesis: Predict a possible answer to the problem or question. Example: If soil temperatures rise, then plant growth will increase.
Steps of the Scientific Method 4. Experiment: Develop and follow a procedure. Include a detailed materials list. The outcome must be measurable (quantifiable).
Steps of the Scientific Method 5. Collect and Analyze Results: Modify the procedure if needed. Confirm the results by retesting. Include tables, graphs, and photographs.
Steps of the Scientific Method 6. Conclusion: Include a statement that accepts or rejects the hypothesis. Make recommendations for further study and possible improvements to the procedure.
Steps of the Scientific Method 7. Communicate the Results: Be prepared to present the project to an audience. Expect questions from the audience.
Think you can name all seven steps? Collect and Analyze Results Formulate a Hypothesis Communicate the Results Observation/Research Problem/Question Experiment Conclusion
Let’s put our knowledge of the Scientific Method to a realistic example that includes some of the terms you’ll be needing to use and understand.
Problem/Question John watches his grandmother bake bread. He ask his grandmother what makes the bread rise. She explains that yeast releases a gas as it feeds on sugar.
Problem/Question John wonders if the amount of sugar used in the recipe will affect the size of the bread loaf?
Observation/Research John researches the areas of baking and fermentation and tries to come up with a way to test his question. He keeps all of his information on this topic in a journal.
John talks with his teacher and she gives him a Experimental Design Diagram to help him set up his investigation.
Formulate a Hypothesis After talking with his teacher and conducting further research, he comes up with a hypothesis. “If more sugar is added, then the bread will rise higher.”
Hypothesis The hypothesis is an educated guess about the relationship between the independent and dependent variables. Note: These variables will be defined in the next few slides.
Do you know the difference between the independent and dependent variables?
Independent Variable The independent, or manipulated variable, is a factor that’s intentionally varied by the experimenter. John is going to use 25g., 50g., 100g., 250g., 500g. of sugar in his experiment.
Dependent Variable The dependent, or responding variable, is the factor that may change as a result of changes made in the independent variable. In this case, it would be the size of the loaf of bread.
Experiment His teacher helps him come up with a procedureand list of needed materials. She discusses with John how to determine the control group.
Control Group In a scientific experiment, the control is the group that serves as the standard of comparison. The control group may be a “no treatment" or an “experimenter selected” group.
Control Group The control group is exposed to the same conditions as the experimental group, except for the variable being tested. All experiments should have a control group.
Control Group Because his grandmother always used 50g. of sugar in her recipe, John is going to use that amount in his control group.
Constants John’s teacher reminds him to keep all other factors the same so that any observed changes in the bread can be attributed to the variation in the amount of sugar.
Constants The constants in an experiment are all the factors that the experimenter attempts to keep the same.
Constants They might include: Other ingredients to the bread recipe, oven used, rise time, brand of ingredients, cooking time, type of pan used, air temperature and humidity where the bread was rising, oven temperature, age of the yeast…
Experiment John writes out his procedure for his experiment along with a materials list in his journal. He has both of these checked by his teacher where she checks for any safety concerns.
Trials Trials refer to replicate groups that are exposed to the same conditions in an experiment. John is going to test each sugar variable 3 times.
Collect and Analyze Results John comes up with a table he can use to record his data. John gets all his materials together and carries out his experiment.
Size of Baked Bread (LxWxH) cm3 Size of Bread Loaf (cm3) Trials Control group
Collect and Analyze Results John examines his data and notices that his control worked the best in this experiment, but not significantly better than 100g. of sugar.
Conclusion John rejects his hypothesis, but decides to re-test using sugar amounts between 50g. and 100g.
Experiment Once again, John gathers his materials and carries out his experiment. Here are the results.
Size of Baked Bread (LxWxH) cm3 Size of Bread Loaf (cm3) Trials Control group
Conclusion John finds that 70g. of sugar produces the largest loaf. His hypothesis is accepted.
Communicate the Results John tells his grandmother about his findings and prepares to present his project in Science class.