Download
1 / 39
390 likes | 530 Views
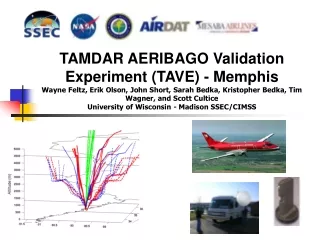
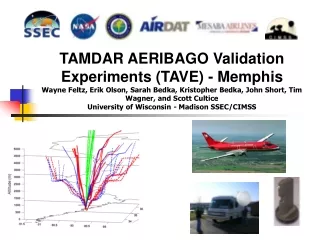
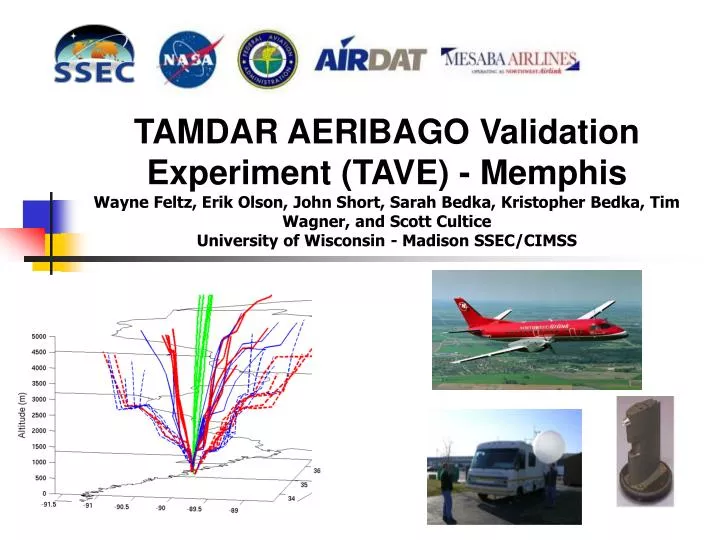
TAMDAR AERIBAGO Validation Experiment (TAVE) - Memphis Wayne Feltz, Erik Olson, John Short, Sarah Bedka, Kristopher Bedka, Tim Wagner, and Scott Cultice University of Wisconsin - Madison SSEC/CIMSS. TAVE OUTLINE. TAVE Experiment Description TAVE Dataset Overview

E N D
TAMDAR AERIBAGO Validation Experiment (TAVE) - MemphisWayne Feltz, Erik Olson, John Short, Sarah Bedka, Kristopher Bedka, Tim Wagner, and Scott CulticeUniversity of Wisconsin - Madison SSEC/CIMSS
TAVE OUTLINE • TAVE Experiment Description • TAVE Dataset Overview • Preliminary Validation Results • Future Analysis and Deployment • Preliminary RUC vs Aircraft Validation
TAVE LOGISTICS • Location: Memphis airport at Air National Guard • Dates/Timing: 23 February - 08 March 2005 • Weather: Dry, cool, two periods of rainfall, very little in the way of high dewpoint events/convection • Data: Made available in near real-time, netcdf format from anonymous ftp server • Radiosondes - 49 total launches • 12 Tail Numbers with TAMDAR instrumentation (excluding the 3 with bad sensors) Web site: http://cimss.ssec.wisc.edu/tamdar/
AERIBAGO INSTRUMENTATION • Vaisala DigiCORA III RS-92 GPS Sounding System • Atmospheric Emitted Radiance Interferometer (AERI) • GPS Receiver • VAISALA Surface PTU Station • VAISALA 25K Ceilometer • http://cimss.ssec.wisc.edu/aeribago/
Instrument Summary • Radiosondes - Vertical temperature and water vapor, Vaisala RS-92 radiosondes, 20 preparation time, 1 1/2 hour flight time, realtime monitoring capability • Surface Station - Vaisala sensors, one minute, p, t, q, v, u, tested and calibrated for accuracy at SSEC • AERI - Vertical temperature and water vapor profiles to three kilometers at ten minute resolution within PBL • GPS - Integrated total water vapor at half hourly time resolution must be at a stationary location for at least ten days • Vaisala Ceilometer - Cloud base heights every ten seconds
Other Datasets Collected • TAMDAR/ACARS Profiles from MADIS and converted to netcdf over Memphis • RUC Analysis Profiles over Memphis • Satellite, radar, and surface imagery • GOES pwv, profiles • All Available at: • ftp://ftp.ssec.wisc.edu/validation/exper/tamdar/data/
Radiosonde Schedule Saab 340s arrive / depart in the following groups (local time): 7:35 - 7:55 Arrive 9:20 - 9:55 Depart 12:36 - 1:15 Arrive 14:15 - 15:00 Depart 17:25 - 18:00 Arrive 19:10 - 19:50 Depart TAVE Radiosonde Launch Time Slots: 8:30, 10:15, 14:15, 17:00, and 19:00 Local time Up to 5 Launches per day Careful attention was paid to keep the radiosonde out of sun and allowing sensor to acclimate to outside environment for several minutes before launch
Radiosonde Ascent Rate 5,000 ft, reached 5 minutes after launch. 1000 ft/min ascent rate. 10,000 ft, reached 12 minutes after launch. 800 ft/min ascent rate. 24,000 ft, reached 30 minutes after launch. 700 ft/min ascent rate. 30,000 ft, reached 43 minutes after launch. 500 ft/min ascent rate. These balloons are smaller and lighter than the ones the NWS launches at 00Z and 12Z at numerous sites across the US.
Excluded Tail Numbers Tail numbers: 5580, 5598 - bad relative humidity information 5552 - bad temperature information
Radiosonde vs TAMDAR Trajectories Dashed - Descending Solid - Ascending Black lines - State Boundaries
Future Validation Improvements • Validation quality of radiosonde water vapor measurements by correlating with Bago surface sensor and AERI radiance intercomparison • TAMDAR sensor QC should be looked at with more scrutiny, maybe rh1 or rh2 should be used instead of rh once consensus between TAMDAR sensor indicates good rh1 or rh2 data • Validation matches should be screened in the vertical as a function of horizontal distance between sensor to help account for horizontal variability of the water vapor
Future Validation ImprovementsContinued • Temperature from ACARS measurements within +/- 30 minutes should be included on rms/bias plots • Time criteria can be tightened with more matches from future deployment • Wind validation using GPS winds from radiosondes vs TAMDAR/ACARS measurements
TAVE Summary • Preliminary Validation is underway • TAVE Data Available: http://cimss.ssec.wisc.edu/tamdar • More extensive validation will be presented at Virginia meeting in September • Next Deployment possible in May or July/August in Memphis
Comparison of TAMDAR and non-TAMDAR with RUC 1 hr forecast Ralph Petersen CIMSS Source statistical data provided by Bill Moninger – FSL http://acweb.fsl.noaa.gov/ruc_acars/ Data from weekly ‘fit’ statistics from Mid-January - Mid-March 2005
Comparison of TAMDAR and non-TAMDAR with RUC 1 hr forecast Bias Temperature (oC) Standard Deviation WMO Temperature Requirements for Regional NWP (RMS) - 0.5 oC, Minimum Acceptable 3.0 oC Source statistical data provided by Bill Moninger - FSL Data from Mid-January - Mid-March 2005
Comparison of TAMDAR and non-TAMDAR with RUC 1 hr forecast Bias Speed (m s-1) Standard Deviation WMO Wind Requirements for Regional NWP (RMS) - 1 m s-1, Minimum Acceptable 5 m s-1 Source statistical data provided by Bill Moninger - FSL Data from Mid-January - Mid-March 2005
Comparison of TAMDAR and non-TAMDAR with RUC 1 hr forecast Bias Relative Humidity (%) Standard Deviation WMO Moisture Requirements for Regional NWP (RMS) - 5%, Minimum Acceptable 20% Source statistical data provided by Bill Moninger - FSL Data from Mid-January - Mid-March 2005
Summary of Comparison of TAMDAR and non-TAMDAR with RUC 1 hr forecast Evaluations performed between TAMDAR and all other aircraft - Need to separate reports from similar parts of atmosphere - Need to view in combination with Rawinsonde Co-Locations - Need to have more Q/C information - WMO criteria used here to exclude outliers - May have been too conservative Two data sets show notably different characteristics - Temperature - More TAMDAR outliers (> WMO Specs) and different (cold) bias - Wind - More TAMDAR outliers and Bias ( 3x ) and Standard Deviation larger - Moisture - No WVSS-II comparison made yet - Bias increases as RH increases - RMS near WMO limits (careful since we are comparing to model forecast/analysis) Issue – Who will manage, maintain and distribute TAMDAR Q/C info? - Currently, WMO requires NWS to do this for other aircraft data.