Download
1 / 11
110 likes | 237 Views
Average Daily Maximum Ozone (ppb). 8. Fujita et al. 2000. Twelve-site Average NMHC and NO at 4-5 a.m. and 7-8 a.m. (PDT) by Day of the Week. 9. Fujita et al. 2000. Average t NO=O3 and t maxO3 and Rates of O 3 Accumulation on Sunday and Wednesday in 1981-84. 11. Fujita et al. 2000.

E N D
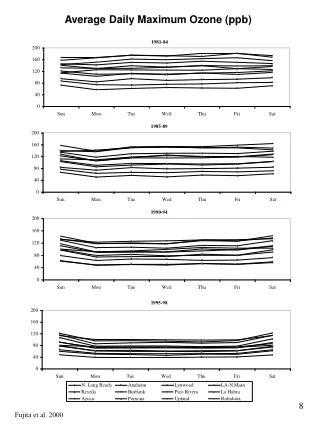
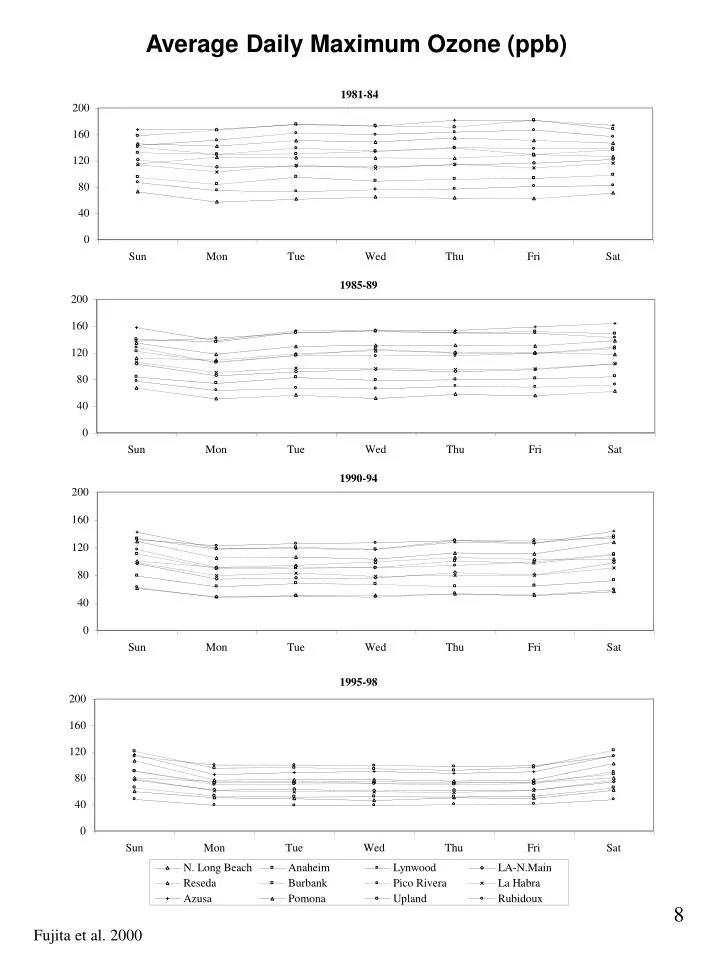
Average Daily Maximum Ozone (ppb) 8 Fujita et al. 2000
Twelve-site Average NMHC and NO at 4-5 a.m. and 7-8 a.m. (PDT) by Day of the Week 9 Fujita et al. 2000
Average tNO=O3 and tmaxO3 and Rates of O3 Accumulation on Sunday and Wednesday in 1981-84 11 Fujita et al. 2000
Average tNO=O3 and tmaxO3 and Rates of O3 Accumulation on Sunday and Wednesday in 1985-89 12 Fujita et al. 2000
Average tNO=O3 and tmaxO3 and Rates of O3 Accumulation on Sunday and Wednesday in 1990-94 13 Fujita et al. 2000
Average tNO=O3 and tmaxO3 and Rates of O3 Accumulation on Sunday and Wednesday in 1995-98 14 Fujita et al. 2000
Trends in Ozone Accumulation Rates on Sunday and Wednesday for Western, Central, and Eastern SoCAB 15 Fujita et al. 2000
Average daily 6-7 a.m. (PST) NMHC/NOx 16 Fujita et al. 2000
Average daily NMHC/NOx at Maximum Ozone 17 Fujita et al. 2000
Ratios of NMHC Source Contributions on Sunday and Saturday to Average Weekday 23 Fujita et al. 2000
Estimation of Relative Contributions of On-Road Spark-Ignition and Compression-Ignition Vehicles [ BC ] BCci VMTci = x [ MTBE ] MTBEsi VMTsi where [ BC ] = measured black carbon concentration in µg/m3 or [nC10-nC15] from Tenax, [ MTBE ] = measured MTBE concentrations in µg/m3, BCci = assumed average CI emission rate of black carbon in grams/mile or heavy HC, and MTBEsi = assumed average SI emission rate of MTBE in grams/mile. VMTci [ BC ] MTBEsi The ratio of VMT, A = = x VMTsi [ MTBE ] BCci Ratio of the CI and SI source contribution estimates (sce) to NO can be estimated from A and assumed average NO emission rates for CI and SI as follows. NOsceci NOci = x A Analogous estimates for NMHC and CO. NOscesi NOsi A can also be estimated from [CO] and [NO]. [ CO ] is proportional to COci x VMTci + COsi x VMTsi and [ NO ] is proportional to NOci x VMTci + NOsi x VMT si where [ CO ] = measured carbon monoxide concentration in µg/m3, [ NO ] = measured nitric oxide concentrations in µg/m3, COci and COsi = assumed average CI and SI emission rates of CO in grams/mile, and NOci and NOsi = assumed average CI and SI emission rates of NO in grams/mile. 1. A is determined from the following equation. 1 + [ CO ] COciA COsi = + [ NO ] NOciA NOsi Fujita et al. 2000 25


![Average fluorescence [Log 10 ]](https://cdn3.slideserve.com/6496934/slide1-dt.jpg)