Download
1 / 11
110 likes | 178 Views
SIERRA OZONE SUMMIT. Deborah Jordan, PhD Air Program Director U.S. Environmental Protection Agency, Region 9. 1. San Bernadino, CA: 121 ppb 2. Los Angeles, CA: 112 ppb Riverside, CA: 112 ppb 4. Kern, CA: 110 ppb 5. Tulare, CA: 103 ppb Harris, TX: 103 ppb

E N D
SIERRA OZONE SUMMIT Deborah Jordan, PhD Air Program Director U.S. Environmental Protection Agency, Region 9
1. San Bernadino, CA: 121 ppb 2. Los Angeles, CA: 112 ppb Riverside, CA: 112 ppb 4. Kern, CA: 110 ppb 5. Tulare, CA: 103 ppb Harris, TX: 103 ppb 7. Fresno, CA: 98 ppb 8. Sacramento, CA: 97 ppb Placer, CA: 97 ppb 10. Nevada, CA: 96 ppb Brazoria, TX: 96 ppb Tarrant, TX: 96 ppb 646 counties monitor ozone nation-wide Based on 2004-2006 data Worst Counties for Ozone
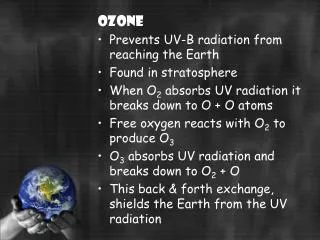
Negative Effects of Ozone • Health Effects • Airway irritation, coughing, and pain when taking a deep breath; • Aggravation of asthma and increased susceptibility to respiratory illnesses like pneumonia and bronchitis; and, • Permanent lung damage with repeated exposures. • Environmental Effects • Damaging the leaves of trees and other plants, negatively impacting the appearance of urban vegetation, as well as vegetation in national parks and recreation areas; and • Reducing forest growth and crop yields, potentially impacting species diversity in ecosystems.
Working Together Toward Clean Air • Air Districts • Develop clean air plans • Develop rules to control stationary sources • Monitor air quality • CA Air Resources Board • Develop and approve District clean air plans • Control mobile source emissions • Develop Statewide rules • Distribute resources • U.S. EPA • Set and Implement Standards • Control mobile sources • Distribute Resources
EPA’s Role –Set and Implement Standards • EPA sets and reviews National Ambient Air Quality Standards every 5 yrs • Process: • Receive State recommendations as to which areas meet or do not meet the standard • Designate and classify areas • Approve and oversee implementation of the clean air plans
EPA's Role - Control Emissions Nonroad Diesel sales over 650,000 / yr 12B gallons / yr final rule 2004 fully phased in 2015 Tier 2 Light-Duty final rule 1999 fully phased in 2009 Diesels held to same stringent standards as gasoline vehicles 2008 2004 2000 1999 Heavy-Duty Highway sales 800,000 / yr 40B gallons / yr final rule 2000 fully phased in 2010 Locomotive/Marine sales 40,000 (1000 locomotives) / yr 6B gallons / yr 2008 fully phased in 2017
EPA’s Role: Distribute Resources • Monitoring • Funds for routine monitoring to characterize local conditions go to State for distribution • EPA sometimes provides monitoring $ for special needs –R9 gave $30,000 to Northern Sierrafor NOx instrument . • Grants for a variety of clean air projects • AirNow
Ways to Reduce Exposure • Pay attention to the air quality index on AirNow • Protect yourself from ozone - stay indoors during peak concentration times on high ozone days • Understand peak concentrations - seasonal and daily pattern
How Do We Get To Clean Air? • Federal and State regulations, especially mobile sources • Local regulations and regional approaches • Personal actions to help clean the air and reduce exposure