Download
1 / 17
170 likes | 274 Views
Item #2. Ozone Season Summary 2014. Sunil Kumar MWAQC-TAC Meeting, COG September 9, 2014. Ozone Season Summary [As of September 3, 2014]. Peak 8-Hour Ozone Concentrations (ppb). Data based on the 8-hour standard set at 75 ppb . Since April 1, 2014, there have been:

E N D
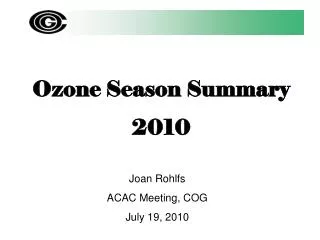
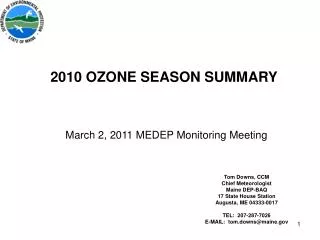
Item #2 Ozone Season Summary 2014 Sunil Kumar MWAQC-TAC Meeting, COG September 9, 2014
Ozone Season Summary [As of September 3, 2014] Peak 8-Hour Ozone Concentrations (ppb) Data based on the 8-hour standard set at 75 ppb. Since April 1, 2014, there have been: 4 Code Orange Days, 39 Code Yellow Days, 112 Code Green Days
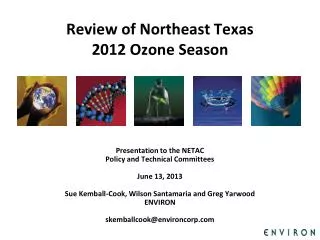
Meteorology Factors on Exceedance Days • August 6, 2014 • High Temperature: 90°F • Light winds • Northwesterly winds brought NOx and ozone from the Ohio River Valley • Clear Skies due to a high pressure system • Similar conditions during the two days prior caused ozone to build up • August 27, 2014 • High Temperature: 90°F • Northwesterly winds brought NOx and ozone from Western PA and OH • High ozone values in Western PA on August 26 • Clear and sunny skies
Ozone Concentration at 3 PM August 26 Ozone concentrations = 70-80 ppb 24 – 32 hours
Ozone Concentration at 3 PM August 27 Ozone concentrations = 70-90 ppb
2014 Ozone Exceedances • Analysis is based on draft data until September 3, 2014. Data is subject to change.
Ozone Exceedance Trend • 2014 analysis is based on draft data as of September 4, 2014 and is subject to change.
90 Degree Days and Exceedance Days • 2014 analysis is based on draft data as of September 3, 2014 and is subject to change.
Why Fewer ExceedanceDays Now ? • Emission Control Programs
These 4th highest 8-hour ozone values in 2015 would lead to non-attainment in 2015 • Analysis is based on draft data until September 3, 2014. Data is subject to change.
Fine Particle Summary [As of September 3, 2014] 24-hour PM2.5 Average (µg/m3) Data based on the 24-hour standard set at 35 µg/m3. Since April 1, 2014, there have been: 49 Code Yellow Days, 106 Code Green Days