Download
1 / 29
290 likes | 399 Views
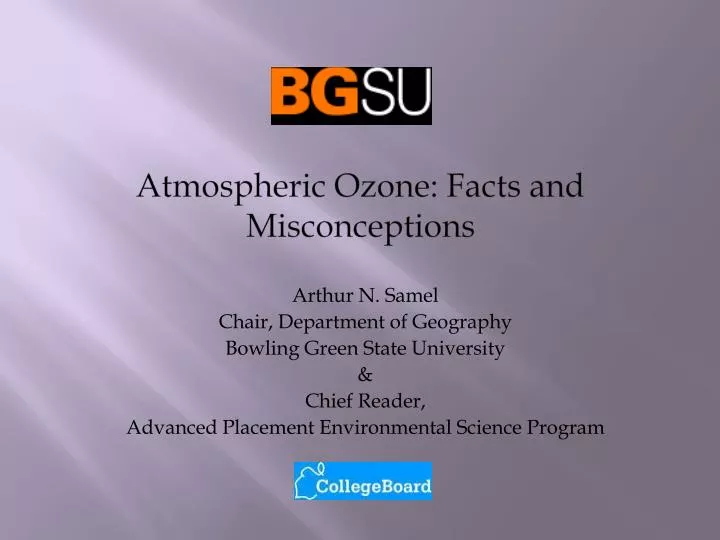
Atmospheric Ozone: Facts and Misconceptions. Arthur N. Samel Chair, Department of Geography Bowling Green State University & Chief Reader, Advanced Placement Environmental Science Program. The concentration of O 3 near the earth’s surface is minute ~40 ppb. Location of stratospheric O 3.

E N D
Atmospheric Ozone: Facts and Misconceptions Arthur N. Samel Chair, Department of Geography Bowling Green State University & Chief Reader, Advanced Placement Environmental Science Program
The concentration of O3 near the earth’s surface is minute ~40 ppb
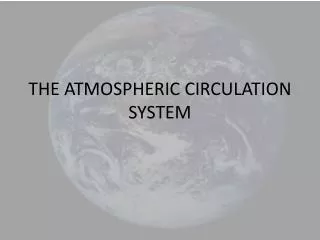
Atmospheric O3 concentration as a function of height/altitude
Stratospheric Ozone “Cycle”: 2O3 + → 2O2 + O ( < 290 nm; UV-B; 90% absorption) 2O2 + 2O → 2O3 O2 + → 2O ( < 240 nm; UV-C; 100% absorption) 2O + O2 → 2O3
CFCs… Oh NO!!!
CFCs are extremely stable molecules in the troposphere and become well mixed. It takes many years (60-100) for CFC molecules to enter the stratosphere. Once in the stratosphere, CFCs absorb UV-C radiation, dissociate, and Cl- radicals are released.
Stratospheric Ozone Destruction: CFCs CFC + → CFC + Cl ( < 215 nm; UV-C) O3 + → O2 + O ( < 290 nm; UV-B) Cl + O3 → ClO + O2 ClO + O → Cl + O2 A single Cl- radical can reside in the stratosphere for nearly a decade and disrupt the formation of several hundred thousand O3 molecules. Increased UV-B reached Earth’s surface
Does the loss of stratospheric O3 enhance the greenhouse effect??? • What is a greenhouse gas? • Transparent to insolation • Absorbs outgoing terrestrial radiation
Rapid Fire Assessment! • Is O3 an atmospheric greenhouse gas? • How can the destruction of stratospheric O3 enhance the atmospheric greenhouse effect? • Does the destruction of stratospheric O3 contribute to warming in the troposphere?
UV-B absorption in the stratosphere IR absorption in the troposphere Energy emission spectra of Sun and Earth (A) and absorption of energy in the Earth’s atmosphere (B).
DU = thickness of compressed atmospheric O3 at 0°C * 100. (e.g., 4mm = 400 DU)
Bar graph of area with Antarctic low O3 concentrations (< 220 DU) during October and November (area of North America ~ 24 million km2).
Bar graph of area with Arctic low O3 concentrations (< 300 DU) during February and March.
Increased rate of skin cancers Increased frequency of cataracts Decreased phytoplankton productivity Decreased photosynthesis rates Decreased plant growth rates Impacts of Increased UV-B at the Earth’s Surface
Atmospheric O3 concentration as a function of height/altitude
NOx Sources NOx Tropospheric Ozone Formation: 2NO + O2 → 2NO2 NO2 + → NO + O O + O2 → O3 VOCs
Ozone formation occurs through the following sequence of reactions. The sequence is almost always initiated by the reaction of various VOC or CO with the OH radical [R1, R2]. This is followed by the conversion of NO to NO2 (through reaction with HO2 or RO2 radicals), which also regenerates OH [R3, R4]. NO2 is photolyzed to generate atomic oxygen, which combines with O2 to create O3 [R5, R6].
Variation in ground level O3 concentration during a typical 24-hour day
New York City, July 10, 2007 New York City, July 16, 2008
L.A. City Hall, 2005 L.A. City Hall, 1953
Number of days when the 1-hour federal O3 standard was exceeded in Los Angeles as well as the 1-hour peak concentration
Rapid Fire Assessment! • Is O3 an atmospheric greenhouse gas? • Does the formation of tropospheric O3 enhance the atmospheric greenhouse effect?
Factors that contribute to atmospheric warming and cooling and our level of understanding
Global Warming Potentials (GWP) and Atmospheric Lifetimes (Years) Used in the Inventory Gas AtmosphericLifetime100-year GWPa20-year GWP500-year GWP Carbon dioxide (CO2) 50-200 1 1 1 Methane (CH4)b 12±3 21 56 6.5 Nitrous oxide (N2O) 120 310 280 170 HFC-23 264 11,700 9,100 9,800 HFC-125 32.6 2,800 4,600 920 HFC-134a 14.6 1,300 3,400 420 HFC-143a 48.3 3,800 5,000 1,400 HFC-152a 1.5 140 460 42 HFC-227ea 36.5 2,900 4,300 950 HFC-236fa 209 6,300 5,100 4,700 HFC-4310mee 17.1 1,300 3,000 400 CF4 50,000 6,500 4,400 10,000 C2F6 10,000 9,200 6,200 14,000 C4F10 2,600 7,000 4,800 10,100 C6F14 3,200 7,400 5,000 10,700 SF6 3,200 23,900 16,300 34,900
Net 100-year Global Warming Potentials for Select Ozone Depleting Substances GasDirectNetminNetmax CFC-11 4,600 (600) 3,600 CFC-12 10,600 7,300 9,900 CFC-113 6,000 2,200 5,200 HCFC-22 1,700 1,400 1,700 HCFC-123 120 20 100 HCFC-124 620 480 590 HCFC-141b 700 (5) 570 HCFC-142b 2,400 1,900 2,300 CHCl3 140 (560) 0 CCl4 1,800 (3,900) 660 CH3Br 5 (2,600) (500) Halon-1211 1,300 (24,000) (3,600) Halon-1301 6,900 (76,000) (9,300)