Download
1 / 13
130 likes | 406 Views
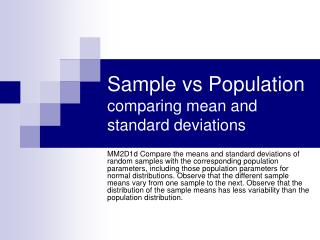
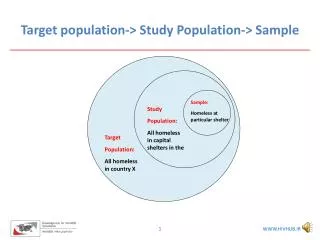
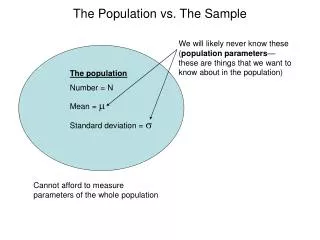
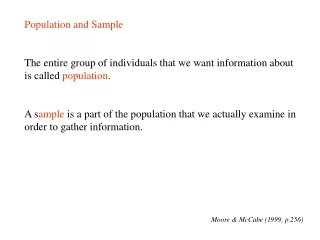
Population and sample. Population is complete actual/theoretical collection of numerical values (scores) that are of interest to the researcher. Simbol = N (hurup besar) Keseluruhan objek yang diteliti, baik orang,benda, kejadian,nilai maupun yang hal-hal yang diselidiki.

E N D
Population is complete actual/theoretical collection of numerical values (scores) that are of interest to the researcher. Simbol = N (hurup besar) Keseluruhan objek yang diteliti, baik orang,benda, kejadian,nilai maupun yang hal-hal yang diselidiki.
Sample is a subset of population. Or a set of observed scores from which the inferences of the population is made. Bagain dari populasi yang akan diselidiki. Simbol = n (hurup kecil)
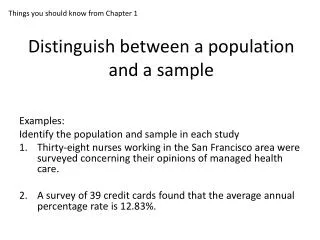
Contoh: Judul penelitian: Stress di kalangan mahasiswa UIN Jakarta. Populasi: Seluruh mahasiswa UIN Jakarta (11.000 mahasiswa) Sample : 10% dari populasi (110 mahasiswa) Difference between population and sample: sample is part of population and its function is to draw the most accurate possible picture of population from the limited data of the sample. Population consists of all possible data.
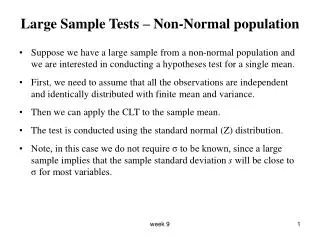
Note: 1. Size of sample is important to make statistical influence. 2. For descriptive statistics, size is not important. 3. Error always exists when we take the sample from population. 4. If we increase the sample size, the error will decrease 5. Probability of error always exists in statistical influence. Sample is different from sampling.
How to determine the size of sample? • Menurut Sutrisno Hadi, tidak ada suatu ketepatan yang mutlak berapa persen suatu sample harus diambil dari populasi. • Beberapa factor yang membuat peneliti mengambil sample: • 1. Biaya (2) tenaga, (3) waktu
Sampling technique: Sampling adalah cara yang digunakan untuk mengambil sample dan biasanya mengikuti teknik atau jenis tertentu. Misalnya random sampling atau non-random sampling. Random sampling Random means that each member of population has an equal chance of being selected as sample. (setiap individu dalam populasi mempunyai peluang dan hak yang sama untuk dipilih sebagai sample). Without randomization the result of data analysis is meaningless.
Simple random sampling technique Cara undi Berdasarkan table bilangan random (Table of random numbers) Random and non-random sampling technique (see attached hand out) Paramatrik/ parametric Non parametric
RANDOM Vs NON RANDOM • Karakteristik • Statistical test (parametric t-test & nonparametric: chi-square)
Why is sample size important? • To make statistical inferences. The bigger the sample size, the more accurate the conclusion.
PENYUSUNAN ITEM • Satu pernyataan tidak lebih dari 20 kata • Satu item tidak boleh menanyakan masalah ganda. • Kejelasan item • Uji coba: • Analisa : spss atau iteman
Try out • Kejelasan item • Waktu diperlukan • Validitas
Sumber kesalahan dalam penelitian • Kesalahan sampling • Kesalahan pengukuran/measurement • Kesalahan spesifikasi teori (eg. Seharusnya menurut teori ada variabel tetapi tidak ada. Atau kesalahan menempatkan asumsi-asumsi yang digunakan berdasarkan teori) • Kesalahan random (rondom lawan sistematik, yaitu unsur X), lebih tepat random diartikan tidak berpola atau tidak sistematik, bukan diartikan acak.