Download
1 / 9
100 likes | 325 Views
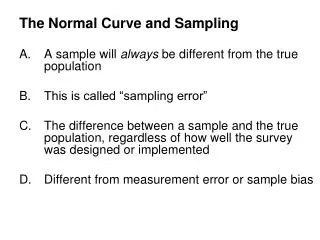
Large Sample Tests – Non-Normal population. Suppose we have a large sample from a non-normal population and we are interested in conducting a hypotheses test for a single mean. First, we need to assume that all the observations are independent

E N D
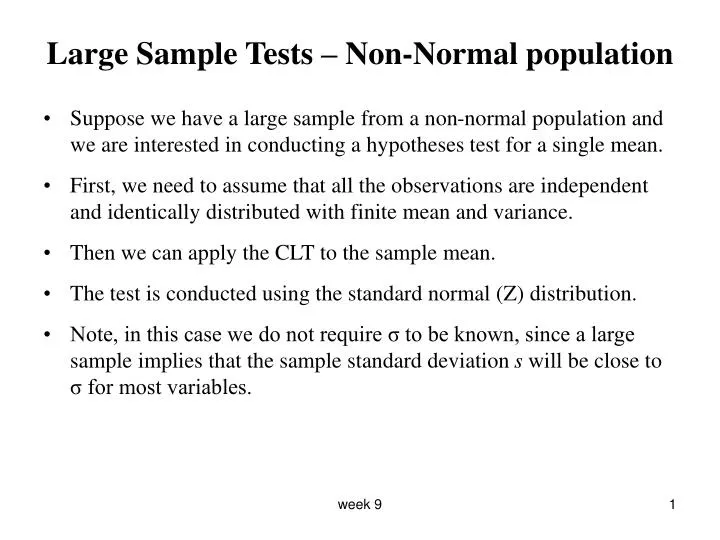
Large Sample Tests – Non-Normal population • Suppose we have a large sample from a non-normal population and we are interested in conducting a hypotheses test for a single mean. • First, we need to assume that all the observations are independent and identically distributed with finite mean and variance. • Then we can apply the CLT to the sample mean. • The test is conducted using the standard normal (Z) distribution. • Note, in this case we do not require σ to be known, since a large sample implies that the sample standard deviation s will be close to σ for most variables. week 9
Example • Do middle-aged male executives have different average blood pressure than the general population? The national center for Health Statistics reports that the mean systolic blood pressure for males 35 to 44 years of age is 128. The medical director of a company looks at the medical records of 72 company executives in this age group and finds that the mean systolic blood pressure in this sample is and the standard deviation is 15. Is there evidence that the executives blood pressure differ from the national average? week 9
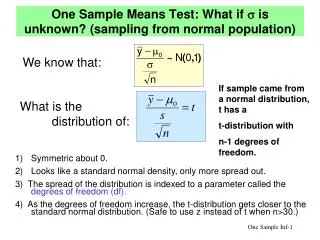
Small Sample Tests for a Single Mean • Suppose we have a small sample and we are interested in conducting a hypotheses test for a single mean. • First, we need to assume that all the observations are independent and identically normally distributed with unknown finite mean and variance. • The CLT does not apply to the sample mean. • The test is conducted using the t distribution with n-1 degrees of freedom. • Note, to be confident in our test results we need to check the normality assumption. week 9
Example • In a metropolitan area, the concentration of cadmium (Cd) in leaf lettuce was measured in 6 representative gardens where sewage sludge was used as fertilizer. The following measurements (in mg/kg of dry weight) were obtained. Cd 21 38 12 15 14 8 Is there strong evidence that the mean concentration of Cd is higher than 12. Descriptive Statistics Variable N Mean Median TrMean StDev SE Mean Cd 6 18.00 14.50 18.00 10.68 4.36 • The hypothesis to be tested are: week 9
The test statistics is: The degrees of freedom are: Conclusions: (Using RR and P-value) week 9
Large Sample Tests–Normal population • Suppose we have a large sample from a normal population and we are interested in conducting a hypotheses test for a single mean. • First, we need to assume that all the observations are independent and identically normally distributed with unknown finite mean and variance. • The CLT is not necessary. • The test is conducted using the t distribution with n-1 degrees of freedom. • Note, if n is large the t distribution with n-1 degrees of freedom converges to the N(0,1) distribution. week 9
Example • The GE Light Bulb Company claims that the life of its 2 watt bulbs normally distributed with a mean of 1300 hours. Suspecting that the claim is too high, Nalph Rader gathered a random sample of 161 bulbs and tested each. He found the average life to be 1295 hours and the standard deviation 20. Test the company's claim using = 0.01. week 9
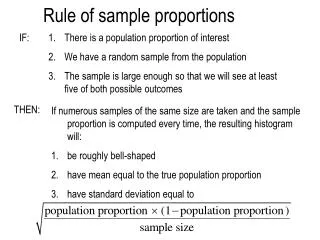
Large Sample Tests for a Binomial Proportion • Suppose we have a large sample from a Bernoulli(θ) distribution. • That is, we assume that all the observations are independent and identically Bernoulli trails. • The sample proportion is in fact the sample mean. • The CLT applies to the sample proportions. • The test is conducted using the standard normal (Z) distribution. week 9
Example • Statistics Canada records indicate that of all the vehicles undergoing emission testing during the previous year, 70% passed on the first try. A random sample of 200 cars tested in a particular county during the current year yields 124 that passed on the initial test. Does this suggest that the true proportion for this county during the current year differs from the previous nationwide proportion? Test the relevant hypothesis using α = 0.05. week 9