Download
1 / 10
120 likes | 319 Views
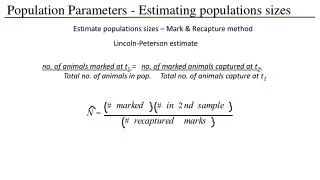
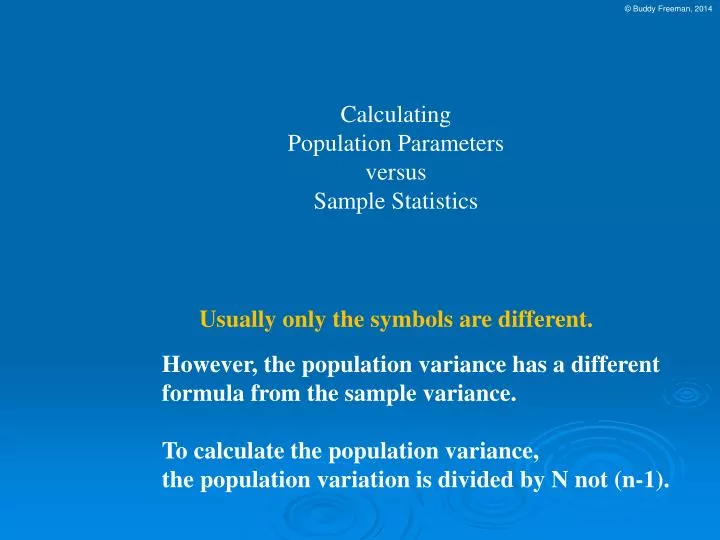
Calculating Population Parameters versus Sample Statistics. Usually only the symbols are different. However, the population variance has a different formula from the sample variance. To calculate the population variance, the population variation is divided by N not (n-1). Populations.

E N D
Calculating Population Parameters versusSample Statistics Usually only the symbols are different. However, the population variance has a different formula from the sample variance. To calculate the population variance, the population variation is divided by N not (n-1).
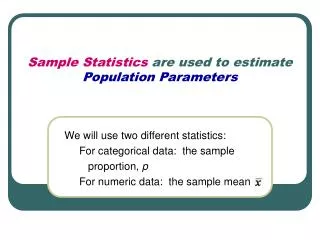
Populations population parameters (mu) is the population mean (sigma) is the population standard deviation Random sample sample statistics
If you know what the mean and the standard deviation are for a population, you can answer lots of questions about that population. Two Population Rules: 1) The Empirical Rule and 2) Tchebysheff’s Theorem.
The Empirical Rule If you have a population that is known to be bell-shaped (mound-shaped) and you know both the mean and standard deviation of the population then, Between 1 standard deviation of the mean there is about two-thirds (68%) of the population’s data; Between 2 standard deviations of the mean there is about 95% of the population’s data; Between 3 standard deviations of the mean there is virtually all (100%) of the population’s data.
The Empirical Rule If you have a population that is known to be bell-shaped (mound-shaped) and you know both the mean and standard deviation of the population then, Between 1 standard deviation of the mean there is about two-thirds (68%) of the population’s data; Between 2 standard deviations of the mean there is about 95% of the population’s data; Between 3 standard deviations of the mean there is virtually all (100%) of the population’s data.
The Empirical Rule If you have a population that is known to be bell-shaped (mound-shaped) and you know both the mean and standard deviation of the population then, Between 1 standard deviation of the mean there is about two-thirds (68%) of the population’s data;
The Empirical Rule If you have a population that is known to be bell-shaped (mound-shaped) and you know both the mean and standard deviation of the population then, Between 1 standard deviation of the mean there is about two-thirds (68%) of the population’s data;
The Empirical Rule If you have a population that is known to be bell-shaped (mound-shaped) and you know both the mean and standard deviation of the population then, Between 2 standard deviations of the mean there is about 95% of the population’s data;
The Empirical Rule If you have a population that is known to be bell-shaped (mound-shaped) and you know both the mean and standard deviation of the population then, Between 3 standard deviations of the mean there is virtually all (100%) of the population’s data.
Tchebysheff’s Theorem Not covered in Spring 2014 Regardless of the distribution of the population, (symmetric, skewed or whatever) at least of the data lies within k standard deviation units of the mean (k > 1).