Download

1 / 56
710 likes | 1.53k Views
Population and sample. Chavanant Sumanasrethakul MD., M.Sc. Department of Preventive and Social Medicine BMA Medical College and Vajira Hospital 13 Oct 2009. จุดมุ่งหมายสำคัญของการศึกษา. นำผลที่ศึกษาไปใช้กับประชากรเป้าหมาย

E N D
Population and sample Chavanant Sumanasrethakul MD., M.Sc. Department of Preventive and Social Medicine BMA Medical College and Vajira Hospital 13 Oct 2009
จุดมุ่งหมายสำคัญของการศึกษาจุดมุ่งหมายสำคัญของการศึกษา • นำผลที่ศึกษาไปใช้กับประชากรเป้าหมาย • ต้องมีกรอบของประชากรที่ถูกต้อง เพื่อได้ประชากรที่ศึกษาที่เป็นตัวแทนที่ดี • ต้องมีขนาดตัวอย่างที่เหมาะสม
Statistical Inference POPULATION SAMPLE INFERENCE Process of making generalisation about a population from a sample.
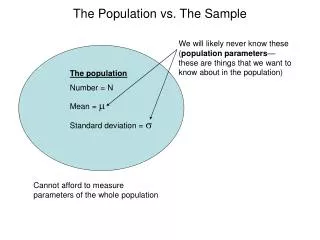
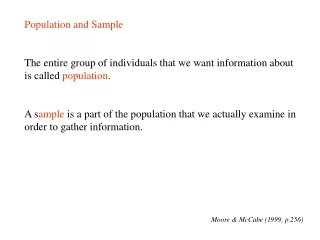
ประชากรและตัวอย่าง • ประชากร (population) คือ สมาชิกทั้งหมดที่เราสามารถนำผลการศึกษาไปประยุกต์ใช้ได้ ซึ่งอาจเป็นคน กลุ่มคน องค์กร หรือเหตุการณ์ • ประชากรเป้าหมาย (target population) คือประชากรที่เรากำหนดกรอบหรือกฎเกณฑ์ให้เจาะจงขึ้น เพื่อตรงกับความประสงค์ของการศึกษา ซึ่งกรอบนั้นขึ้นกับวัตถุประสงค์ คำถามการวิจัย หรือเกณฑ์ที่มีผู้กำหนดไว้แล้ว
ประชากรและตัวอย่าง • ประชากรที่ใช้ศึกษา (study population) คือ ประชากรที่ผ่านเกณฑ์การคัดเลือกที่จะนำมาศึกษาโดยเป็นตัวแทนที่ดีสามารถครอบคลุมประชากรเป้าหมายได้เกือบทั้งหมด ซึ่งเกณฑ์ในการพิจารณา (eligibility criteria) มีทั้งการเลือกเข้าและคัดออกโดยพิจารณาจาก 1) เลือกสถานที่ 2) คุณลักษณะของประชากร เช่น เพศ อายุ ระยะของโรค ประชากรที่ติดตามได้ โรคอื่นๆที่เกิดร่วม ความยินยอม
Population Research Question Target Population EligibilityCriteria Study Population Sampling Sample Allocation/ Randomization Control Group Experiment Group
Point to consider Representativeness External validity Sampling bias Response bias Measurement error
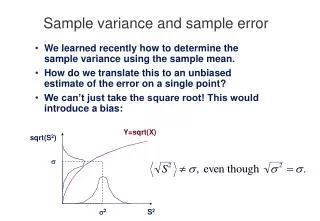
Example • Imagine that a random sample of 100 individuals is to be selected from a population • Their height in cm is measured • The mean height is computed • Another random sample of 100 individuals from the same population is taken • Their height in cm in measured • Their mean height is computed • This is repeated until 20 random samples have been taken
20 samples of size 100 The first sample of heights of 100 people gives a mean of 172.03 cm and a standard deviation (SD) of 6.03 cm. The second sample gives mean 173.50 cm & SD 6.74 cm. These figures represent the mean height (cm) for each of the 20 random samples 172.03 173.50 171.89 171.95 170.59 172.63 172.72 171.99 172.50 171.71 172.55 172.86 171.58 172.83 172.55 171.28 172.62 171.41 171.38 172.26
Simple random sampling • Each item in the population has an equal chance of being selected for the sample Random number table • 84 42 56 53 87 75 • 78 87 77 03 57 09 • 85 86 48 86 12 39 • 65 37 93 76 46 11 • 09 49 41 73 76 49 • 64 06 71 99 37 06 • 46 69 31 24 33 52 • 67 85 07 75 56 96
Systematic sampling • Advantages - It is simpler and can be more representative than a simple random sample • Disadvantages - possibility of implicit clustering, not a simple random sample
Stratified sampling • Increases the representativeness of the sample • Increases the precision of the resulting estimates • Allows comparison between strata
1 n1 children n2 children 2 Schools sample (…) (…) 20 n20 children (population) (clusters) Cluster sampling • Disadvantages - Less representative than a simple random sample and there is a danger of contamination between respondents • Advantages - Cheaper and faster than a simple random sample
H areas (patients) Multi-stage sampling • Different sampling units are sampled at different stages Example Geographical areas of Thailand would randomly be selected, from which hospitals would be randomly selected from which wards/patients would then be randomly selected.
Non-probability sampling • การเอกตัวอย่างแบบกำหนดจำนวนไว้ก่อน (quota sampling) • การเลือกตัวอย่างแบบสะดวก (convenience sampling) • การเลือกตัวอย่างตามมิติ (dimensional sampling) • การเลือกตัวอย่างแบบมีจุดมุ่งหมาย (purposive sampling) • การเลือกตัวอย่างแบบลูกโซ่ (snowball sampling)
Probability sampling • Advantages • (easy to analyse) • should be unbiased • known precision • Disadvantages • requires sampling frame to be known • expense
Non-probability sampling • Advantages • cheap • Quick • Disadvantages • may be biased • no estimate of precision
Sample size • Why is it so important? • How do you calculate it? • What information do you need?
Sample size (i) • Sample size important because : • too small a sample will fail to detect clinically important effects • too large a sample will identify statistically significant differences which have no clinical relevance • both situations unethical
Factors which determine sample size calculation • The study design • (Survey), comparative, repeated measures • The outcome measure • categorical, continuous • The statistical analysis • t-test, chi-squared, regression
Comparative studies • Null hypothesis: • Treatment A = Treatment B • Alternative hypothesis • Treatment A Treatment B
Significance level and power • Significance Level (Type I error rate) • This is the probability that the statistical test returns a significant result when there is no difference between treatments • Power (Type II error rate) • This gives the probability that a study of a given size would detect, as statistically significant, a real difference of a given magnitude
Factors which affect sample size • The proportion with/average of the feature of interest in the control group • Minimum clinically significant difference • The smallest difference in effectiveness between two treatments that would be deemed to be clinically relevant • Significance level • Power • Measure of variability
Example of categorical data • How many children with acute otitus media are needed in a clinical trial to test whether antibiotic treatment changes the proportion of children with normal eardrums • Statistical Test for this sort of data? • The null hypothesis in this example? • What information do we need to calculate the sample size?
That’s the way to do it! • The proportion with the feature of interest in the control group i.e. • An estimate proportion with normal ear drums when not treated, 75% • The increase/decrease in the proportion of interest judged to clinically significant • In this case, 10% • Power and significance levels • 80% power and 5% significance
Continuous outcome • How many patients are needed in a trial to evaluate the effect of supplementary vitamin D given to pregnant women in preventing neonatal hypocalcaemia? (Want to increase the mean serum calcium level!) • Statistical Test? • Null hypothesis?
Continuous (continued) • Difference in mean serum calcium level that would be considered a clinical improvement • Increase of 0.5mg per 100ml • Estimate of the variation between infants in their serum calcium level • sd = 1.8 mg per 100ml (where do we get this info?) • Power and significance level • 80% and 5 % • Calculate standardised difference • standardised difference = difference/sd
Limitations • Sample size calculation is not an exact science, could be considered informed guess work • Need for general consensus on what constitutes clinically important • Reporting of a sample size calculation does not infer that the study is adequately powered, study may not have recruited as many people as they anticipated, or suffered dropouts or loss to follow-up
The truth is out there • An accurate inference is required to be both precise and unbiased • Steps should be taken to ensure that this is so • Minimise bias by • (adequate) randomisation • concealment and blinding • checking that missing data does not follow patterns • Maximise precision • formal statistical power calculation • CONSORT statement! (see references)
Quantitative Method (การวัดเชิงปริมาณ) Qualitative Method (การวัดเชิงคุณภาพ)
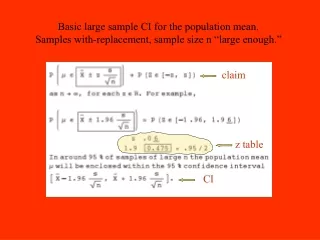
Proportion response variable The one-sample problem Estimating the population proportion (P) Where d = Precision or difference (| p - P|) Z = 1.96 at 95% CI 1.64 at 90% CI P = the proportion in population or the true proportion n = Z2 P (1 - P) d2
ตัวอย่าง ต้องการประมาณสัดส่วนของความดันโลหิตสูงในผู้สูงอายุ การศึกษาความชุกในอดีตเท่ากับร้อยละ 20 และความคลาดเคลื่อนที่ยอมรับได้เท่ากับร้อยละ 5 P = 0.2 1- P = 0.8 Za at 5% = 1.96 d = 0.05 or 5% ( Absolute diff.) n = 246
ตัวอย่าง Comparing n in different P, d at a = .05 P dn 0.2 0.02 1537 0.03 683 0.04 384 0.05 246 0.30.02 2017 0.03 896 0.04 504 0.05 323
Continuous response variables The one-sample problem Estimating the population mean n = Za22 d2 2 = variance of data d = precision or | X - m|
Hypothesis testing Ho : P1 - P2 = 0 Ha : P1 - P2 = 0 n|group = {Za 2Pc(1-Pc) + Zb Pt(1-Pt) + Pc(1-Pc) }2 (Pt - Pc)2 where Pt = treatment, Pc = control Za at two-tailed (1.96)or one-tailed test (1.64) Z at one-tailed test Power = 1 – Note : this formula is derived for equal sized group
Hypothesis testing for two population means Ho = m1 - m2 = 0 Ha = m1 - m2 = 0 n|group = 2 s2 [ Za+Zb ]2 [m1 - m2]2
Sample size for dependent samples 2 n pair = (Za + Zb) s • s = variance of the within pair diff. • = the value of the mean diff. • that is clinically important • to detect
Unmatched Case-Control Studies Schlesselman (1982) 2 n|group = Z 2Po(1-Po) + Z P1(1-P1)+P2(1-P2) P1 - P2 P1 = P2 (OR) 1+P2 (OR-1) P2 = the proportion exposed in control OR = odds Ratio Po = (P1+P2) /2 where
matched Case-Control Studies 2 N pair = Z 2 + Z 2P1P2/ P1 - P2 P1 = ma/N P2 = mb/N = (P1 + P2) / 2 where
Cohort Studies 2 n|group = Z 2P(1-P) + Z P1(1+R-P1(1+R2)) P1(1-R) P1 = Incidence of non exposure R = Relative risk P = (P1(1+R)) / 2 where