Download
1 / 12
120 likes | 272 Views
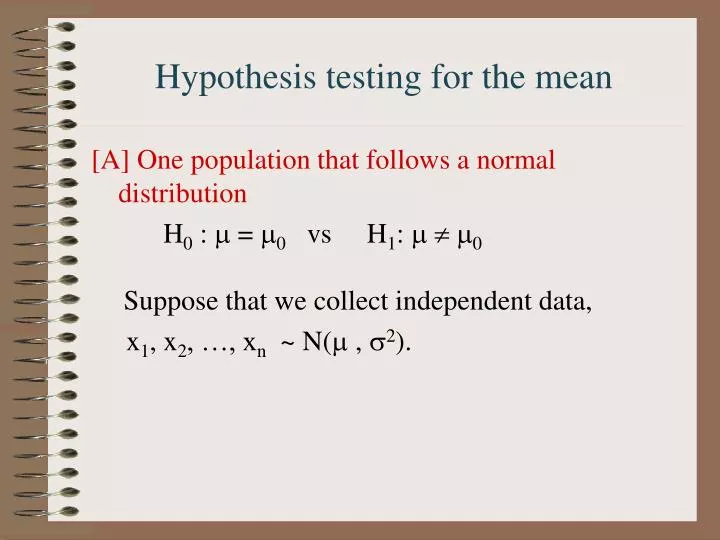
Hypothesis testing for the mean. [A] One population that follows a normal distribution H 0 : = 0 vs H 1 : 0 Suppose that we collect independent data, x 1 , x 2 , …, x n ~ N( , 2 ). (1) When the population variance is known, use z-test

E N D
Hypothesis testing for the mean [A] One population that follows a normal distribution H0 : = 0 vs H1: 0 Suppose that we collect independent data, x1, x2, …, xn ~ N( , 2).
(1) When the population variance is known, use z-test then z is referred to N(0,1). (2)When the population variance is unknown, use t-test i.e., replace the population variance with the sample variance and then t is referred to the t-distribution with n-1 degrees of freedom.
[B] Two-normal-population case H0 : 1 = 2 vs H1: 1 2 Assume that we collect independent data, x11, x21, …, xn1 ~ N(1, 12) and x12, x22, …, xm2 ~ N(2, 22).
(1) When the population variances are known and 1 = 2, then z is referred to N(0,1). (2)When the population variances are known and 1 2 then z is referred to N(0,1).
(3) When the population variances are unknown but know 1 = 2, where then t is referred to t-distribution with n+m-2 degrees of freedom. Note: s2 is called pooled sample variance.
(4) When the population variances are unknown and know 1 2, then t is referred to t-distribution with df degrees of freedom,
Hypothesis testing for the variance [A] Assume that we collect independent data, x1, x2, …, xn ~ N( , 2). Want to test H0 : 2 = 02 vs H1: 2 02.
Compute Then, 2 is referred to 2-distribution with n-1 degrees of freedom.
[B] Assume that we collect independent data, x11, x21, …, xn1 ~ N(1, 12) and x12, x22, …, xm2 ~ N(2, 22). Want to test H0 : 12 = 22 vs H1: 12 22
Compute Then, F is referred to F-distribution with n-1 and m-1 degrees of freedom.
Analysis of variance (ANOVA) [A] One-way ANOVA Assume that we collect independent data, x11, x21, …, xn1 ~ N(1, 2), x12, x22, …, xm2 ~ N(2, 2), …, x1k, x2k, …, xpk ~ N(k, 2). Want to test H0 : 1 = 2 = …= k vs H1: not H0
We may rephrase the problem xi j = j + i j, i j ~ N(0, 2), the hypotheses can be rewritten as H0 : 1 = 2 = …= k = 0 vs H1: not H0 One-way ANOVA is a statistical model to test the above H0 vs H1