1 / 1

Distribution of Per Capita Income of the Medicare Population, By Race/Ethnicity, 2012

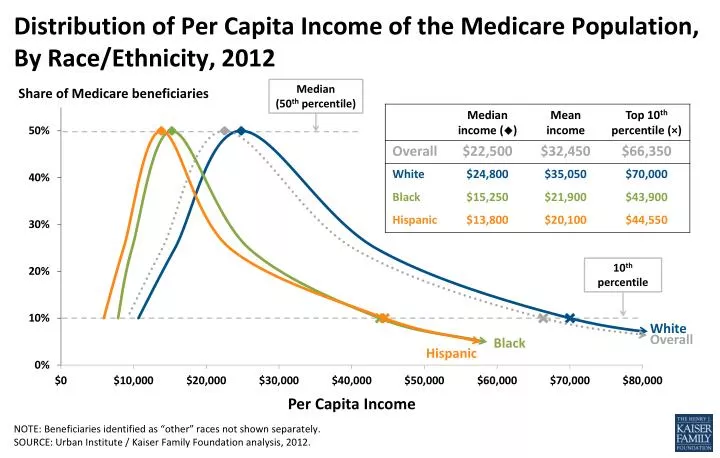
Distribution of Per Capita Income of the Medicare Population, By Race/Ethnicity, 2012. Median (50 th percentile). Share of Medicare beneficiaries. 10 th percentile. White. Overall. Black. Hispanic. Per Capita Income.

belita
Download Presentation

Distribution of Per Capita Income of the Medicare Population, By Race/Ethnicity, 2012

An Image/Link below is provided (as is) to download presentation Download Policy: Content on the Website is provided to you AS IS for your information and personal use and may not be sold / licensed / shared on other websites without getting consent from its author. Content is provided to you AS IS for your information and personal use only. Download presentation by click this link. While downloading, if for some reason you are not able to download a presentation, the publisher may have deleted the file from their server. During download, if you can't get a presentation, the file might be deleted by the publisher.

E N D

Presentation Transcript


  1. Distribution of Per Capita Income of the Medicare Population, By Race/Ethnicity, 2012 Median (50th percentile) Share of Medicare beneficiaries 10th percentile White Overall Black Hispanic Per Capita Income NOTE: Beneficiaries identified as “other” races not shown separately. SOURCE: Urban Institute / Kaiser Family Foundation analysis, 2012.

More Related