Download
1 / 70
730 likes | 1.05k Views
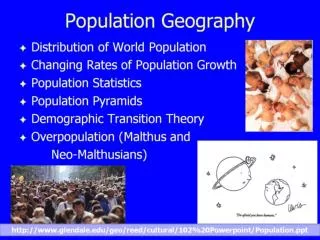
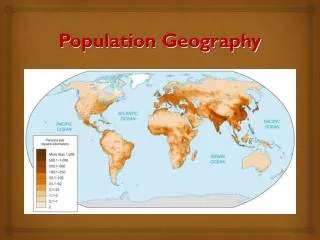
Population Geography I. The Where and Why of Population Density Distribution Demographics (Characteristics) Dynamics. Cultural Hearths of Civilization. 5000 BC. Year 1. 1500. 1900. World Population. World Population Cartogram. Population by continents.

E N D
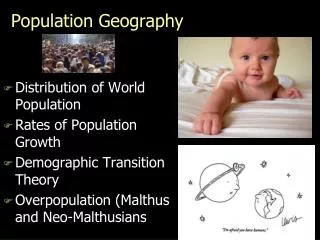
Population Geography I The Where and Why of Population • Density • Distribution • Demographics (Characteristics) • Dynamics
Lower 48 states 94.7 NJ 1134 Lincoln Co., NV 0.4 Manhattan 66,834 Wisconsin 98.8 Eau Claire Co. 146 Florence Co. 10.4 Milwaukee Co. 3885 Select Population Densities(people/mi2)
Canada 8 Russia 22 United States 80 Holland 1002 Bangladesh 2261 Egypt 173 people/mi2 3% of area inhabited Nile River 6000 people/mi2 Population Densities(people/mi2)
Demography:Population characteristics • Ascribed characteristics • Achieved characteristics
Characteristics • Ascribed • Gender • Race • Age • Achieved • Education • Income • Occupation • Employment • Etc.
DynamicsRate of Natural Increase (RNI) Births - Deaths = RNI
National population Births - Deaths + Immigration (in) • Emigration (out) = Population growth
Doubling Time Number of years it will take for population to double, at current rate United States: 117 years Nicaragua: 21 years
Infant mortality rate(deaths of infants <1 year old) Lack of maternal health care or child nutrition
Philadelphia Infant Mortality Red area high than at least 28 “Third World” countries, including: Jamaica Cuba Costa Rica Malaysia Panama Sri Lanka South Korea Taiwan Uruguay Argentina Chile
Dependency Ratio • Dependents are under 15 & over 65 • How many are supported by 15-65 group • Problems?
“Graying of the Core” • Low birth and death rates in Core • Low population growth (except immigration) • Steadily older population
Baby Boom (1946-1964) Baby Bust (1965-1980)
Baby Boom impacts yet to come • Strain on Social Security • Growing health care costs • Challenge to youth identity (Gen. X)