Download
1 / 12
130 likes | 212 Views
Large-Scale Variability of Salinity in the subtropical North Atlantic. -------- A preliminary study for the Synthesis of the SPURS Field Program. Tangdong Qu and Linlin Zhang. International Pacific Research Center, University of Hawaii. General characteristics from WOA05. MLD>100. >37.2.

E N D
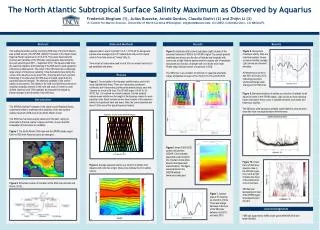
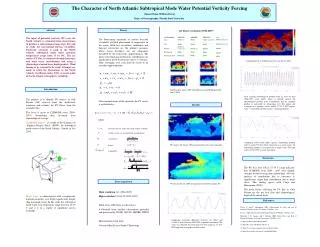
Large-Scale Variability of Salinity in the subtropical North Atlantic -------- A preliminary study for the Synthesis of the SPURS Field Program Tangdong Qu and Linlin Zhang International Pacific Research Center, University of Hawaii
General characteristics from WOA05 MLD>100 >37.2 25.5 σθ 25.5 σθ 100 m 1oom STUW Salt River
SSS from Aquarius Consistent, with some quantitative differences MLD >37.2 30-month average All-time average Variability?
Argo floats Argo profiles + CTD Our goal: To investigate salinity variability using Argo data combined with observations from SPURS-1.
SSS and vertical salinity maximum from Argo Salinity of vert. Salinity Max Density of vertical salinity maximum (>36.5psu) Well between 25 and 26 σθ Vertical salinity maximum takes place at subsurface and is spread over the entire subtropical region.
EOF modes of salinity on 25-26 kgm-3 Similar to the mean S. 57% 21% There is a trend (jump) of up to 0.2-0.3 psu during 2005-2013.
EOF modes of SSS 32% 1st mode is dominated by the variability in the western part of basin (river discharge?) 37psu weak 23% 37psu strong 2nd mode is dominant in the STUW formation region, with a maximum SSS taking place in 2012 (SPURS-1).
Salinity section along the subsurface salinity core Vertical section along saline core of STUW Mean salinity in the vertical salinity Maximum Formation of STUW The subsurface salinity maximum (STUW) is linked to the SSS maximum.
Connection between subsurface salinity and SSS Mean SSS The first mode of subsurface salinity (STUW) is closely related to SSS variability. Salinity in the SSS maximum area and EOF1 of salinity on 25-26 kgm-3
EOF modes of E-P (OAFlux, GPCP) 32% 32% 23% 17% The EOF-1 patterns are consistent, indicating the dipole structure of SSS in the western N. Atl. is dominated by E-P. But, the EOF-2 patterns differ, suggesting the SSS maximum is also governed by ocean processes.
For a longer period (1979-2012), EOF modes of E-P show both NAO and ENSO signature 27% -EOF1 and NAO 14% -EOF2 and Nino 3.4 EOF1 is negatively correlated with NAO EOF2 is negatively correlated with Nino3.4
Summary • Subsurface salinity (STUW) shows a significant interannual variability during the past decade, which is closely related to the variability of surface salinity maximum; • Both SSS and subsurface salinity (STUW) show an upward trend (time series is too short) ? • E-P variability shows both NAO and ENSO signature, but this variability alone cannot explain the SSS and STUW variability. To be continued…. Thank You !